It’s clear science journalists need some help. The IPCC are saying “The ocean ate my global warming” and most environment reporters just cut-n-paste this excuse — they fall for the breathtaking joules-to-the-22nd-figures — not realizing they convert to a mere 0.07C over nearly 50 years (as if we could measure the average temperature of the global oceans to a hundredth of a degree!). Worse, the warming we do find is so small, it supports the skeptical calculations, not the IPCC’s ones. I ran a tutorial for journalists at the end of the post, and asked Bob Tisdale (author of Climate Models Fail ) if he had some other questions. He did, oh boy, and here they are. Thanks to Bob. – Jo
—————————————————————————————————–
Questions the Media Should Be Asking the IPCC – The Hiatus in Warming
Joanne Nova asked me to suggest questions the media should be asking the IPCC about their 5th Assessment Report (AR5). I’ve provided a few examples along with background information.
This post will discuss the slowdown in global warming since 1998 (or the halt since 2001) known as the hiatus. While the hiatus in warming had been the topic of many blog posts around the blogosphere over the past few years, public awareness of the pause in surface temperature warming skyrocketed with David Rose’s 13 October 2012 Daily Mail article titled “Global warming stopped 16 years ago, reveals Met Office report quietly released… and here is the chart to prove it”.
————————————
1. Why did the IPCC simply glance over the well-known hiatus period in their Summary for Policymakers?
Background Information:
In their Summary for Policymakers of their 5th Assessment Report, the IPCC made only very brief references to the cessation of warming, coming to no conclusions about it.
In their approved Summary for Policymakers dated 27 September 2013, the IPCC states on page SPM-3:
In addition to robust multi-decadal warming, global mean surface temperature exhibits substantial decadal and interannual variability (see Figure SPM.1). Due to natural variability, trends based on short records are very sensitive to the beginning and end dates and do not in general reflect long-term climate trends. As one example, the rate of warming over the past 15 years (1998–2012; 0.05 [–0.05 to +0.15] °C per decade), which begins with a strong El Niño, is smaller than the rate calculated since 1951 (1951–2012; 0.12 [0.08 to 0.14] °C per decade)5. {2.4}
And on page SPM-13:
The observed reduction in surface warming trend over the period 1998–2012 as compared to the period 1951–2012, is due in roughly equal measure to a reduced trend in radiative forcing and a cooling contribution from internal variability, which includes a possible redistribution of heat within the ocean (medium confidence). The reduced trend in radiative forcing is primarily due to volcanic eruptions and the timing of the downward phase of the 11-year solar cycle. However, there is low confidence in quantifying the role of changes in radiative forcing in causing the reduced warming trend. There is medium confidence that internal decadal variability causes to a substantial degree the difference between observations and the simulations; the latter are not expected to reproduce the timing of internal variability. There may also be a contribution from forcing inadequacies and, in some models, an overestimate of the response to increasing greenhouse gas and other anthropogenic forcing (dominated by the effects of aerosols). {9.4, Box 9.2, 10.3, Box 10.2, 11.3}
The discussion by the IPCC includes the terms “low confidence” and “medium confidence”, indicating the IPCC hasn’t a clue about what caused the halt in warming.
————————————
2. In Figure SPM.1, the IPCC shows that hiatus periods can last for 3 to 6 decades. Why then is there no mention of that possibility in the future?
Background Information:
The IPCC has failed to address something that is blatantly obvious in their Figure SPM.1 from the AR5 Summary for Policymakers. (See the reduced size copy in my Figure 1.) Since the 1850s, and before the current hiatus, there were two multidecadal periods when global surface temperatures stopped warming and actually cooled.
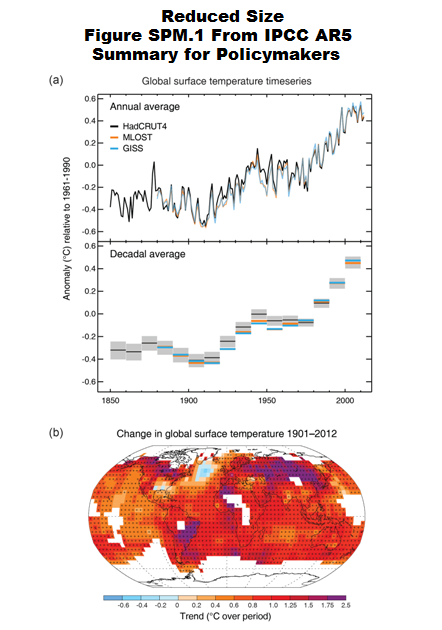
Figure 1
That means most persons will conclude that it’s very likely the current hiatus could last for at least 3 decades. See my Figure 2.
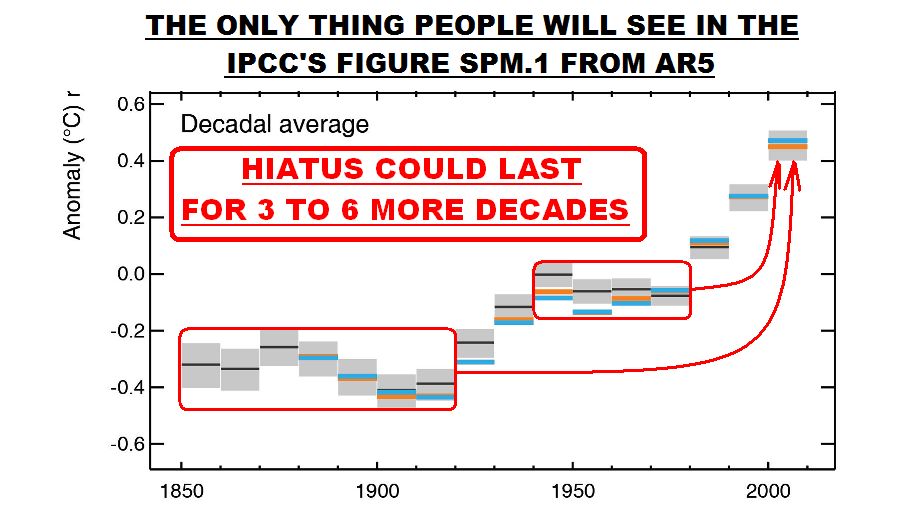
Figure 2
And that, of course, leaves questions in everyone’s minds about the validity of the IPCC 5th Assessment Report.
————————————
3. After decades of efforts, why can’t the climate models used by the IPCC simulate coupled ocean-atmosphere processes that cause multidecadal variations in sea surface temperatures and, in turn, land surface air temperatures?
Background Information:
There are a number of reasons the IPCC has avoided any discussion of the possibility the current hiatus could last for at 3 decades. First, that would mean their projections of future global warming are useless. (More on this later.)
The second reason is more damning of the climate models used by the IPCC. They cannot simulate the coupled ocean-atmosphere processes that cause multidecadal variations in observed sea surface temperatures. These processes are most evident in the sea surface temperature data of the Northern Hemisphere.
1. Atlantic Multidecadal Oscillation
(This discussion is from my recent blog post Models Fail: Land versus Sea Surface Warming Rates. I’ve changed the illustration number for this post.)
Climate models used by the IPCC for the 5th Assessment Report do not properly simulate the AMO (Atlantic Multidecadal Oscillation). In Climate Models Fail, I presented a number of scientific studies that were very critical of how models simulated many variables, including the Atlantic Multidecadal Oscillation. (See Ruiz-Barradas, et.al. (2013) is “The Atlantic Multidecadal Oscillation in twentieth century climate simulations: uneven progress from CMIP3 to CMIP5”.)
We can illustrate the Atlantic Multidecadal Oscillation using the method recommended by Trenberth and Shea (2006), and it was to subtract global sea surface temperature anomalies (60S-60N, excludes the polar oceans) from sea surface temperature anomalies of the North Atlantic (0-60N, 80W-0). They used HADISST data and so have I. In the time-series graph in Figure 3, I’ve also smoothed the AMO data with a 121-month running average filter. As shown by the blue curve, the North Atlantic has a mode of natural variability that causes its sea surface temperatures to warm and cool at rates that are much greater than the variations in the surface temperatures of the global oceans. And we can see that the variations occur over multidecadal time periods (thus the name Atlantic Multidecadal Oscillation). Keep in mind that the Atlantic Multidecadal Oscillation is responsible for some (but not all) of the warming of land surface temperatures in the Northern Hemisphere during the more recent warming period, according to the climate scientists at RealClimate. (See also Tung and Zhou (2012) Using data to attribute episodes of warming and cooling in instrumental records.)

Figure 3
If we subtract the modeled global sea surface temperatures from the modeled sea surface temperatures of the North Atlantic (shown as the red curve in Figure 3), we can see that the forced component of the CMIP5 models (represented by the multi-model ensemble mean) does not simulate the observed multidecadal variations in the North Atlantic. That is, there is very little difference between the modeled variations in global and North Atlantic sea surface temperature anomalies. The comparison also strongly suggests that the Atlantic Multidecadal Oscillation is NOT a response to manmade greenhouse gases (or aerosols) used by the climate modelers to force the warming (or cooling) of sea surface temperatures of the North Atlantic.
# # #
For further information about the Atlantic Multidecadal Oscillation, see NOAA’s AOML (Atlantic Oceanographic and Meteorological Laboratory) Frequently Asked Questions webpage here, and my blog post here and my introduction to the Atlantic Multidecadal Oscillation here.
2. North Pacific Multidecadal Variability
The North Pacific also exhibits multidecadal variations in sea surface temperatures. Unfortunately, the climate science community presents those variations in a very abstract (statistically created) form called the Pacific Decadal Oscillation. To further complicate matters, the variations in the Pacific Decadal Oscillation Index are actually inversely related to the sea surface temperatures of the region of the North Pacific from which the Pacific Decadal Oscillation index is derived. That, of course, is confusing to most persons.
In the North Pacific, the variations are dominated by the sea surface temperatures of an area east of Japan known as the Kuroshio-Oyashio Extension (or KOE). The inverse relationship between the Pacific Decadal Oscillation index and the sea surface temperatures of the Kuroshio-Oyashio Extension are shown in Figure 4. They’re basically mirror images of one another.
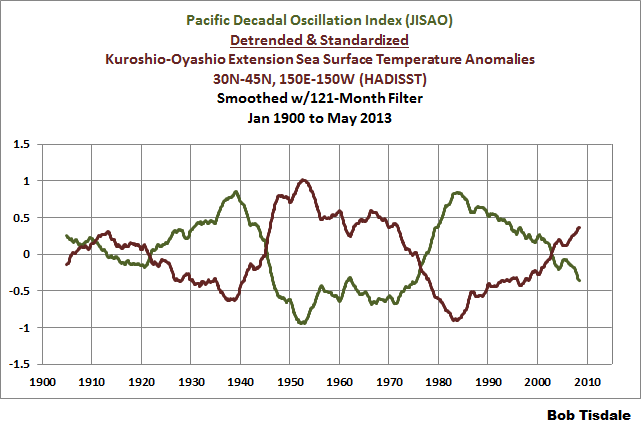
Figure 4
(Note: In Figure 4, the Kuroshio-Oyashio Extension data have been detrended, and they have been standardized (divided by their standard deviation) because the Pacific Decadal Oscillation Index is standardized.)
Because we’re interested in sea surface temperatures and not an abstract form of them, we’ll use the sea surface temperatures of the Kuroshio-Oyashio Extension for much of this discussion.
Let’s see whether the models can simulate the multidecadal variations in the sea surface temperatures of the Kuroshio-Oyashio Extension. For this example, we’ll subtract the global sea surface temperatures from the sea surface temperatures of the Kuroshio-Oyashio Extension. (It’s similar to the method used by Trenberth and Shea for the Atlantic Multidecadal Oscillation.) The coordinates used for the Kuroshio-Oyashio Extension data are 30N-45N, 150E-150W and the global sea surface temperature data are for all of the global oceans, 90S-90N. (The multidecadal variations in the Kuroshio-Oyashio data in Figure 5 are different those in Figure 4 because they were determined using different methods. Also note they have not been standardized in Figure 5.) As shown with the blue curve in Figure 5, there are very large multidecadal variations in the sea surface temperatures of the Kuroshio-Oyashio Extension after the global data has been subtracted.

Figure 5
On the other hand, using the models prepared for the IPCC’s 5th Assessment Report, we get totally different results when we subtract the modeled global sea surface temperatures from the modeled sea surface temperatures of the Kuroshio-Oyashio Extension. (See the red curve in Figure 5.) This indicates the models do not simulate the multidecadal variations in the sea surface temperatures of the Kuroshio-Oyashio Extension. Because the variations in the surface temperatures of the Kuroshio-Oyashio Extension region dominate the North Pacific, the failure of the models to show the same multidecadal variations suggests that greenhouse gases (and aerosols) used in the models are not responsible for the warming (and cooling) in North Pacific sea surface temperatures.
For further information about the Pacific Decadal Oscillation (what it is and what it is not) refer to my blog posts here, here and here.
————————————
4. Why aren’t the climate models used by the IPCC expected to simulate multidecadal variations in global surface temperatures?
Background Information:
We discussed and illustrated (above) how the climate models used by the IPCC cannot simulate the multidecadal variations in the sea surface temperatures of the North Atlantic and the North Pacific. Regarding the hiatus period, the IPCC included on page SPM-10 (my boldface):
There is medium confidence that internal decadal variability causes to a substantial degree the difference between observations and the simulations; the latter are not expected to reproduce the timing of internal variability.
One wonders how climate models can have any value at all if they are “not expected to reproduce the timing of internal variability”—especially when one considers that internal variability was a strong contributor to the warming that occurred from the mid-1970s to the turn of the century…and has now stopped that warming.
This failure to properly simulate the timing and strength of internal variability caused a former lead author of the IPCC (Kevin Trenberth) to remark in David Appell’s 7 May 2013 article “W(h)ither global warming? Has global warming slowed down?”
“One of the things emerging from several lines is that the IPCC has not paid enough attention to natural variability, on several time scales,” he [Dr. Trenberth] says, especially El Niños and La Niñas, the Pacific Ocean phenomena that are not yet captured by climate models, and the longer term Pacific Decadal Oscillation (PDO) and Atlantic Multidecadal Oscillation (AMO) which have cycle lengths of about 60 years.
Additionally, the Royal Netherlands Meteorological Institute (KNMI) recently prepared and presented their recommendations for the future of the IPCC. [Refer to their document titled Submission by The Netherlands on the future of the IPCC.] Under the heading of “The IPCC needs to adjust its principles”, KNMI begins:
We believe that limiting the scope of the IPCC to human-induced climate change is undesirable, especially because natural climate change is a crucial part of the total understanding of the climate system, including human-induced climate change.
————————————
5. Why has the IPCC chosen to hide the fact that climate models cannot simulate the hiatus in global warming?
Background Information:
My Figure 6 is the approved final version of Figure 1.4 from Chapter 1 of the IPCC’s AR5. It compares observed global surface temperature anomalies to the spaghetti plot of outputs from the climate models prepared for the 4th Assessment Report (AR4) published in 2007, using a number of scenarios. (Scenario A1B was used and presented most often by the IPCC in AR4.) Also included in their Figure 1.4 are ranges of model predictions from prior assessment reports: FAR is the 1st Assessment Report, SAR is the 2nd, and TAR is the 3rd. Notice how it shows the last few years of global temperature data within the extreme lower range of the climate model outputs. This suggests a few of the models (the models with the very slow warming rates) capture the slowdown in warming since 1998…and the cessation of warming we’ve been experiencing since 2001.
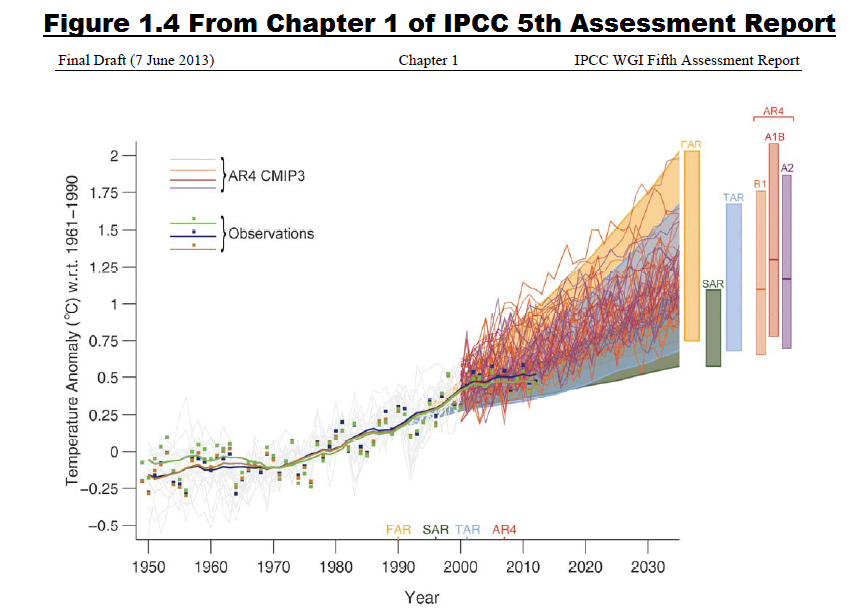
Figure 6
It’s difficult to imagine why the IPCC would include the model outputs from the 1st, 2nd and 3rd Assessment Reports, they were obsoleted by models used in the 4th Assessment Report, or why the IPCC would include the scenarios of the 4th Assessment Reports where greenhouse gas emissions were less than those that have occurred. Clearly, by including all of these meaningless model outputs, their intent was to hide the fact that the models most widely used in the 4th Assessment Report failed to simulate the hiatus period.
I have included here as my Figure 7 the former version of the same illustration (Figure 1.4). It is from the Second Order Draft of Chapter 1 of the IPCC’s 5th Assessment Report. In it, the observed global surface temperatures in recent years are below model prognostications. Clearly, the final version (Figure 6) is attempting to hide the fact that the models have grossly overestimated the warming.
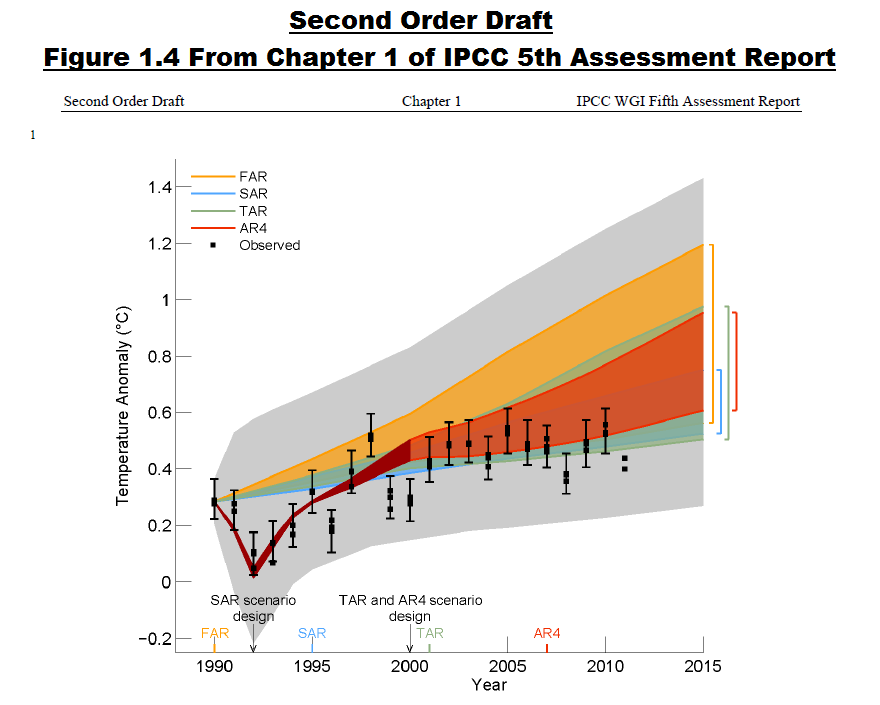
Figure 7
Keep in mind, the illustration in the Second Order Draft (Figure 7) was prepared by climate scientists for politicians, and that the changes (Figure 6) were required by the politicians who approved the IPCC’s AR5.
It’s obvious that because the models cannot simulate the absence of warming, they cannot be used to attribute to manmade greenhouse gases the warming that occurred from the mid-1970s to the turn of the century—and they cannot be used to project future global surface temperatures. It’s no wonder the politicians who approved AR5 requested/required that change.
————————————
6. Why is the IPCC defining the hiatus period with the start date of 1998, or with a 15-year period, when the surface temperatures of many parts of the global oceans have not warmed (or have actually cooled) for 20 years to more than 30 years? And why do the climate models used by the IPCC show warming in those ocean basins?
Background Information:
In all of the discussions of the global warming hiatus in AR5, the IPCC starts the hiatus period in 1998, limiting the hiatus period to the last 15 years. They also limit the presentation to the data and models that represent the combined global land surface air plus sea surface temperatures. This discussion shows that the hiatus period has lasted much longer than 15 years in some ocean basins.
For the past couple of years, I have been presenting model-data comparisons for sea surface temperature anomalies during the satellite era. I also included more up-to-date versions of those comparisons in my recently published book Climate Models Fail. The following graphs are from the book.
(Note: this discussion includes the latest and greatest models prepared for the IPCC’s 5th Assessment Report, as represented by the multi-model ensemble-member mean of the sea surface temperature simulations.)
The Southern Ocean (90S-60S) surrounds Antarctica. With the Antarctic Circumpolar Current, the Southern Ocean serves as the hub for the Atlantic, Indian and Pacific basins. Spatially complete sea surface temperature data have only been available for the Southern Ocean since the early 1980s with the introduction of satellite-based measurements. Over the past 3+ decades and based on the linear trend, the sea surface temperatures of the Southern Ocean have cooled, Figure 8, but the models show they should have warmed if sea surface temperatures were warmed by manmade greenhouse gases.

Figure 8
As defined by the coordinates of 90S-90N, 180-80W, the Eastern Pacific Ocean stretches from pole to pole and from the dateline to Panama. The East Pacific covers approximately 33% of the surface of the global oceans. The sea surface temperatures for the East Pacific (Figure 9) show little to no warming for more than 3 decades, based on the linear trend. On the other hand, if sea surface temperatures were warmed by manmade greenhouse gases, climate models show the sea surface temperatures of the East Pacific should have warmed about 0.45 deg C in that time. Apparently, the surface of the East Pacific Ocean has not been warmed by manmade greenhouse gases.

Figure 9
Using the coordinates of 60S-65N, 120E-80W, the sea surface temperature data for the entire Pacific Ocean is shown in Figure 10. The Pacific Ocean is so large it covers more of the surface of the planet than all of the continental land masses combined. Yet, based on the linear trend, the surface of the largest ocean on Earth has not warmed in 2 decades. Contrary to the observations-based data, the models indicate the surface of the Pacific Ocean should have warmed about 0.4 deg C in that time—under the obviously flawed assumption that manmade greenhouse gases warm the surface of the Pacific Ocean.

Figure 10
(Note: For those with a copy of my recent book, Figure 8 is Figure 7-6 in Climate Models Fail. Figure 9 is Figure 7-31 in the book and Figure 10 is Figure 7-26.)
SUMMARY
The IPCC’s 5th Assessment Report was obviously incomplete in its portrayal and discussion of the recent hiatus in global warming. Some people might even go so far as to say the IPCC has misled the public and policymakers intentionally.
DATA SOURCE

(Click the book to find out more).
The data and model outputs presented in the graphs prepared by me for this post are available through the KNMI Climate Explorer. For those who would like to replicate my graphs, refer to my blog post Step-By-Step Instructions for Creating a Climate-Related Model-Data Comparison Graph.


Perhaps we should “adopt-a-journalist” and buy our favourite science journalist a copy of Bob’s book?
220
Jo, we’d also have to hire an interpreter to explain Bob’s book to them. This could be difficult, as “reputable” scientists who would admit to understanding Bob’s book are thin on the ground.
140
The English language develops rapidly. It’s amazing how the word, “reputable” has gone from valedictory to derogatory in about 72 hours.
90
Are you claiming that “reputable” is has now become a disreputable word? Is it now to be treated as being irreputable? Shall it henceforth, be a word of ill repute? Shall its reputation lie in tatters?
No, I say. Because “reputation” is a neutral noun, and can imply either good or bad connotations within society. The word “reputable” is similarly a neutral adjectival variation of the noun “reputation”, so it too can carry good or bad connotations.
We all have reputations. I have one for seeing the world slightly differently to other people. Does that make me reputable or disreputable? That depends on the judge, and not the judged.
80
“I have one for seeing the world slightly differently to other people. Does that make me reputable or disreputable?”
Disreputable, definitely. If you do not see things the way I do then you are just plain wrong!
– signed, every politician that ever made a decision on climate change.
100
Thank you!
I also believe in growing old disgracefully.
90
Stop doing it so well 🙂
00
English grammar means little if you’re into neurolinguistic programming and carefully-crafted logical fallacies disseminated to the ill-informed.
20
Most journo’s would unfortunately not have the intellect, nor the time, to review the essential information provided here.
Something like this might help them in a 10 minute read:
ttp://www.reallibertymedia.com/2013/10/the-latest-global-warming-push/
00
Kevin, unlike this blog post, I had a (non-technical) interpreter proofread and edit “Climate Models Fail”. See the preview:
http://bobtisdale.files.wordpress.com/2013/09/preview-climate-models-fail.pdf
Regards
181
Dear Bob. Delighted to have given you the opportunity for the Shameless Plug. My remarks were aimed at those who will not see or hear. I have the greatest respect for your oeuvre, having lurked at WUWT for many a year. I have even flung funds in your direction, but try to control the habit less it overcomes my slender means. May you continue to inform us as a truly reputable scientist for many years to come.
50
There is an MSM Journalist born every minute – they don’t question anything.
80
Thanks, Joanne.
191
Outstanding work as usual. Thank you Bob.
120
Amazing work Bob, thank you so much. Even I am able to largely understand what you have written so your ability to interpret and communicate the information is first class. Well done.
100
Fantastic work Bob, FWIW coming from a non scientific background I find your information is relatively straight forward to understand and interesting to boot.
You can’t do much better than that. 🙂
10
Funny that. When I was at uni, the subjects I did we’ll in we’re due to the ability of the lecturer to convey the subject matter in a clear and concise manner.
10
[…] UPDATE: Jo Nova introduced her cross post Six question the media should be asking the IPCC: […]
00
We keep hearing that the Politicians went to Stockholm and changed the IPCC report all about! See for instance the change of Figure 1.4 of Chapter 1 of the 5th Assesment Report in Question 5 above.
Who are these politicians, and more specifically, who was the Australian representive at the conference?
150
These things never stand on their own. Politicians, from around the world, will have used the threat of rampant climate change to justify all sorts of domestic political initiatives that they had an interest in seeing succeed.
The thoughts of having the rug pulled out from under their favorite scheme would have been enough for them to have brought pressure to bear on getting the bits they relied upon toned down.
I don’t know who the Australian representative was, but I bet he or she, would have been up there with the rest of them, working to protect their specific interests.
If you can imagine a lot of spoilt kids fighting over a birthday cake …
100
It is not politicians who edit the SPM, but representatives of national governments–and they are usually activists within their environmental departments. Few legislators attend (I think).
90
If you were playing cards that would be called a full house.
And for good measure, Bob threw in the ace up his sleeve to make a pair of Aces in case any one denied.
Thanks for playing.
90
AS long as he’s not holding Aces and Eights. 😮
00
Thank you Bob.
Just how the oceans were supposed to have gained and kept all that heat is a mystery. You have demonstrated why the mechanism is irrelevant if the supposed result is non-existent.
130
Sorry Ken, you don’t seem to understand the mechanism.
The special CO2 heat bypasses 700m+ of the surface of the oceans and plays peek-a-boo right down the bottom of the Marinated Trench where no one can find it.
160
Marinated Trench? A trench immersed in wine? No wonder they are hiding it below 700 metres!
Oh, you mean Mariana Trench? Well, that may be just as deep, but definitely less interesting.
140
Marinated Tench?
If you marinate a fish.
Or Marinated in Trench (drunk in a ditch)
80
More like Marinated Stench
10
Perhaps the IPCC are drowning their sorrows in the “Marinated Trench”?
30
They’re just another tranche of marionettes.
10
I thought Marinated was most apt.
After all, these IPCC bozos would have to be either pickled, (or high) to think anyone other than a politician or a journalist would swallow their mumbo jumbo bumpkin.
110
That one was actually intentional, as well 🙂
90
I bet you say that to all the girls 😉
60
Well, yes… but it doesn’t help… at all 🙁
50
You took the words
Right outta my mouth.
But it wasn’t because ……..
KK
00
Hmmmmmmmmmmmm, marinated trench.
10
When they calculate the multi-model mean, does that include all the “low CO2 output” models ?
ie the model results if we had ceased CO2 output completely?
I remember the warmists saying how good Hansen’s lowest projection was doing because it was only slightly above the measured temperatures, forgetting that it was a zero emissions scenario. Made them look very silly.
90
AndyG55, the CMIP5 archive (used by the IPCC for AR5) includes a bunch of GISS model “experiments”; 8 in total, with many of the “experiments” including as many as 6 model runs. But these are newer models with forcing scenarios designed for AR5.
Regards
80
I think I have said this before. (probably several times)
As long as they hindcast to pre-1979 Giss/HadCrut, they are ALWAYS going to end up projecting higher than reality.
Either they fix the “adjustments” (and slow much less warming) or keep being wrong.
catch 22 !
50
ps.. And some climate panic goose on the Bolt blog was complaining about Steve McIntyre leaving out A1T models off his comparison analysis.
My response to him never got published (too late in the day I guess) 😉
00
And WHY is anyone even bothering with HadCrut pre-1979.??
Most of that trend between 1960 and 1990 comes from “adjustments”
The measured temperatures around the 1940’s were about 0.5C higher, as were those in the late 1800’s, putting them up there with 1990’s and 2000’s temperatures.
90
Thank you for this outstanding post Jo and Bob.
To my mind, one glaring fact that the MSM ignore and one that appears to be widely glossed over is the difference between the colloquial use of the word ‘Ocean’ and the context in which it is used by the IPCC. The IPCC delineate the known (superficial layer 2000m), except when they’re babbling catastrophe, in which case they simply use the colloquial meaning.
I have posted on this before so forgive the reiteration. The Deep Ocean (below 2000m) constitutes 90% total Ocean volume. Very close to NIX is known in climateland about the Deep Ocean – it is for all intents and purposes a colossus of a heat sink, one of millenial proportion with an ambient temperature of 0 – 3C.
The superficial layer of Ocean above the 2000m mark, a thin layer above the thermocline, has been penetrated in a very limited manner by, amongst other investigations, the Argos buoy system.
The climastrologers are doing with the “Ocean” what they did with the atmosphere in 1990. Any moment now, I fully expect to see a Mannian publication ‘demonstrating’ the Hockey Schtick of Ocean Warming.
Remember, you read about it here first!
120
Took the words right outta me mouth Manfred. Well done.
20
Manfred, if memory serves, there is a hockey-stick paleo reconstruction of sea surface temperatures. Wanna guess who one of the authors is?
100
Ahh yes Bob. Thanks. Sigh. Nothing new under the sun. My enthusiasm, partly as the result of it being Friday, got the better of me.
40
.
With all due respect to Bob, back in the 80’s when I dealt regularly with them, the average MSM journalist had a functioning IQ of about 70, and the attention span of a gnat. The selection criteria has been significantly dumbed-down since then.
The average journalist today would not make it three sentences into this article before losing the plot completely, and wandering off instead to check their smartphone for messages.
You want their undivided attention?
Treat them like idiots. Tell them that they are idiots. Rub their faces in the fact that they are idiots. That they have been taken for idiots by the IPCC. Mock them about how easy it was for the IPCC to pull the wool over their eyes and treat them like idiots.
Really make it hurt. Tell them it was even easier for the IPCC to make fools of them, than it was for the IPCC to fool Greg Hunt. They’re even stupider and more gullible than Greg Hunt, and that’s saying something.
Laugh a lot.
Then hang up.
They WILL call back.
221
I understand that newspapers and web sites generally pitched at a reading age of around 8 – 11 years of age? And if they’re not, they’re roundly accused of, amongst other things, elitism and inaccessibility.
Journalistic immersion in the medium would possibly lead to a state of permanent regression? Any wonder that uncritical catastrophism is such and easy sell.
40
“They’re even stupider and more gullible than Greg Hunt”
gees MV, you don’t pull your punches, do you. 🙂
That is seriously HARSH !!!
80
Sounds like you are talking about Delingpole there.
08
“even stupider and more gullible than Greg Hunt”
And J.B. arrives as if on cue !!
50
Gee… where you been JB? ….. we have missed your untelligent input.
10
basic questions haven’t being answered: expanding oxygen & nitrogen when warmed up ad to the expanding the volume for cooling space: http://globalwarmingdenier.wordpress.com/unavoidable-two-hurdles-to-cross/
10
Agreed Stefan,
The basic science is said to be beyond dispute, but there are some basic questions which are hotly debated, for which I have been unable to find good empirical evidence. Some examples:
1. A greenhouse gas like CO2, should heat up when exposed to infrared radiation from heat lamp,
2. Atmospheric gases should be hotter the lower they are in a gravity field,
3. (Have to be careful here or Jo will snip me), Radiation emitted by a surface, if sent back from an outer reflective shell should cause the surface to be warmer.
A few amateurs have been trying to create experiments to resolve these questions, but mainstream scientists and climate institutes do not seem to be interested.
21
Absolutely pathetic!
Is the new bandwagon the yellow submarine? Surely after this rubbish is debunked the warmist options would be spent or does the cycle reset?
70
1 Oct: LasVegasReviewJournal: Editorial: Global warming alarmists push false premises
If you think coming upticks in fuel taxes and water rates are alarming, then you won’t want the Intergovernmental Panel on Climate Change to have its way with your power bill…
But pesky climate change skeptics persist. Last month, The Associated Press reports, the United States and several European governments tried to persuade the panel’s climate scientists to downplay or even delete evidence of the lack of global warming over the past 15 years, despite rapidly rising global greenhouse gas levels over that same period.
Why would those governments go to such measures? Because such information doesn’t fit the narrative the climate change lobby and their media allies have sold for more than two decades…
Last week, the former vice president (Al Gore) said, “There needs to be a political price for climate (change) denial.” News flash: The First Amendment protects the free speech rights of Americans, especially political speech. Mr. Gore’s rhetoric shows climate change is less about science and more about politics; he’s saying global warming is a political cause…
Green energy already is driving power bills ever higher, thanks to government subsidies and mandates. Let the global market set the price of natural resources. Let the free market determine which fuels produce our electricity. The global warming agenda is bad policy based on false premises, and the sooner elected officials stop bowing to climate change, the better off we’ll be.
http://www.reviewjournal.com/opinion/editorials/editorial-global-warming-alarmists-push-false-premises
still keen to know if these claims are correct. in south-east queensland, it has been a mild Spring so far:
3 Oct: Australian: AAP: September Hottest on Record
September was the hottest spring opener on record, with the national average temperature a sizzling 2.75 C above usual…
The sweltering September was yet another climate record to tumble this year, with Australians this year already enduring the hottest January, hottest summer and hottest single day ever.
In its second report, the new Climate Council warns Australia is breaking all the wrong records when it comes to weather.
“Temperature records are broken from time to time in Australia but it is the sheer number of records being broken that is really unusual,” the council’s Will Steffen said in a statement…
***The council already has raised nearly $1 million in donations to continue its work providing expert independent information about climate change to the Australian public.
http://www.theaustralian.com.au/news/latest-news/september-hottest-on-record/story-fn3dxiwe-1226732022605
10
28 Sept: GlobalVoices: Kevin Rennie: Crowd-funding Revives Australian Climate Council After Government Axe
Over 800,000 Australian Dollars ($USD 730,000) have been raised in its first three days according to its Facebook page:
“20,000 incredible Australians have chipped in over $800,000 in just three days. Together you have crowd-funded science with people power – and put us back in business”…
Solar company Energy Matters argued in an online article entitled Out of the Ashes : The Climate Council:
“But a phoenix has arisen from the ashes after an outpouring of support and offers of donations from the public to maintain the crucial work”…
[Please Note: The author of this post,(Kevin Rennie) who is a member of the opposition Australian Labor Party, has made a donation to the Climate Council.]
http://globalvoicesonline.org/2013/09/28/crowd-funding-revives-australian-climate-council-after-government-axe/
20
adopt-a-journalist?
2 Oct: Guardian: John Ashton: The BBC betrayed its values by giving Professor Carter this climate platform
How can letting a geologist appear as a legitimate climate scientist to ridicule the IPCC report be in the public interest?
Outside his native Australia, Bob Carter is hardly a household name. But last Friday his gravelly brogue was inescapable, at least for anyone tuned to BBC radio news bulletins…
To present Carter as an authoritative commentator on climate science may not be downright dishonest. But it is certainly not of good report. By the most generous standards it is a serious lapse if not a betrayal of the editorial professionalism on which the BBC’s reputation has been built over generations…
As Danny Boyle recognised in his much-applauded Olympic ceremony last year, the BBC is part of who we are in Britain. For some time, and unconnected with climate change, vultures have been circling around it. The BBC should now explain how its decision to give such a platform to Carter serves the public interest. Otherwise it will be undermining its friends when it needs them most, and throwing the scavengers a piece of its own flesh.
http://www.theguardian.com/commentisfree/2013/oct/01/bbc-betrayed-values-carter-scorn-ipcc
Guardina: John Ashton
John Ashton is a director of E3G and a fellow of the Grantham Institute for Climate Change at Imperial College. From 2006-12 he was special representative for climate change for three successive foreign secretaries.
http://www.theguardian.com/profile/john-ashton
2 Oct: Guardian: Fiona Harvey: BBC coverage of IPCC climate report criticised for sceptics’ airtime
Steve Jones among experts querying BBC ‘false balance’ in giving climate sceptics ‘undue’ voice on global warming study
PHOTO CAPTION: Steve Jones, above, said he previously advised the BBC not to present climate-change sceptics as having equal scientific weight with mainstream researchers…
According to John Ashton, formerly the top climate-change official at the Foreign Office, the BBC’s coverage of last week’s report from the Intergovernmental Panel on Climate Change was “a betrayal of the editorial professionalism on which the BBC’s reputation has been built over generations”…
Steve Jones, the scientist (biologist) who was asked by the BBC two years ago to assess its science coverage, accused a senior official there of misrepresenting him in a parliamentary committee and of failing to take on board one of his key findings regarding false balance in the reporting of science…
Earlier in the day, the Today programme had said it could not find any British climate scientists who disagreed with the IPCC’s core findings.
Ashton, who has been trenchant in his criticism of government on climate change since leaving the civil service, said: “The BBC should now explain how its decision to give a platform to Carter serves the public interest…
On Twitter, on Friday, the BBC’s coverage of the IPCC stirred up a storm, with many followers unhappy about the extent of the airtime given sceptics.
Doug Parr, chief scientist at Greenpeace, told the Guardian: “With the exception of Newsnight and the science unit, the BBC’s coverage of the recent climate report seems to have been compromised by its fear of certain newspapers. Media coverage of contested issues is all about narratives and whose you adopt…
(Bob Ward,Grantham Research Institute on Climate Change and the Environment): …”In particular, the World At One on Friday provided a stunning display of false balance when it devoted less airtime to IPCC scientists than it did to Bob Carter, a sceptic who is funded by a free-market lobby group in the US, the Heartland Institute. Carter was allowed to make a number of inaccurate and misleading statements unchallenged.”
“In science, those viewpoints that are supported by robust reasoning and evidence are accorded greater weight, but the BBC does not always reflect this.
“Listeners to the World At One on Friday would not have gathered that there is overwhelming scientific consensus that climate change is happening and that it is driven by greenhouse gas emissions and deforestation. More than 99% of journal papers and all major scientific organisations around the world are part of this consensus.”
http://www.theguardian.com/media/2013/oct/01/bbc-coverage-climate-report-ipcc-sceptics
100
Hmm,
That has ruffled a few feathers.
Surely, if they knew their their conclusions were based on solid evidence, and robust and reproducible science, they would have little to fear.
So, what do you suppose it is, that they are trying to hide?
Some inquiring minds would like to know.
90
Rereke Whakaaro –
u say “I don’t know who the Australian representative was” in Stockholm, but the secrecy is equally shocking as regards the Trans Pacific Partnership, which could be agreed this month, without the Australian public – apart from the STAKEHOLDERS – having been informed of its contents. our negotiations have been undertaken by Labor & Coalition Govts, yet we are kept in the dark!
24 Aug: DFAT: Ministerial guidance energizes negotiators work during 19th round of TPP Negotiations
Bandar Seri Begawan, Brunei – Trans-Pacific Partnership (TPP) negotiators intensified their work this week to close gaps between them as directed by their Ministers, who met last week in Brunei Darussalam to discuss possible landing zones on remaining sensitive and challenging issues and sequencing of issues in the final talks…
The intersessional work is intended to further advance the negotiations in the lead up to APEC Leaders meeting in Bali, Indonesia, on the margins of which TPP Leaders are expected to meet as they have in past years. This meeting will be an important milestone as the 12 countries work intensively to conclude this landmark agreement this year.
On August 27, the TPP negotiations were temporarily adjourned so that negotiators could meet with 150 stakeholders on site from across the TPP region. Stakeholders made presentations to negotiators on a wide range of issues, and Chief Negotiators met informally with stakeholders to discuss in detail on specific issues of interest to them.
http://www.dfat.gov.au/fta/tpp/130824-tpp-stakeholder-update-19.html
30
Pat,
As far as I am aware, the TPP is a mutual agreement to remove tariff, and customs barriers between Pacific countries. It is particularly useful to Pacific countries, in gaining trade access to Japan, Korea, et al, at a level that well allow them to compete.
I am not aware of any side agreements that are attached to the primary agreement.
Mind you, that does not mean that there aren’t any. Sometimes trade access comes at a price, if you get my drift.
30
You’re not aware? Well that’s a relief. What you don’t know can’t hurt you, right?
heheh.
It takes something really diabolical to get the leftists [PDF] and the right wing [web] united in opposition to it.
A very early draft leaked in 2011 contained such delightful measures as:
According to Wallach’s study:
Sounds like the Kiwis were happy to roll over and take it.
But perhaps in this case ignorance is bliss.
Yes, it’s just “a mutual agreement to remove tariff, and customs barriers”.
10
The questions and answers are great. But what appears even more interesting are the cracks between the “team” and the IPCC. I guess the IPCC has exceeded even their capacity for BS.
30
You want Media people – reporters, journalists – to ask questions?
Are they allowed to do that?
60
They have always been allowed to do that.
The problem is, they never get the “right” answer.
50
Then why don’t they?
30
I have no idea. I work, from time to time, in political circles, and I ask questions, and I get reasonable answers, and those answers allow me to get my job done.
A journalist can ask the same questions about the same subject, and get a slightly different answers, presumably because they are pre-prepared by a press officer, for handing out to a journalist. But then, the answers are different again when they appear in print or in a broadcast, which says that the editorial process has gotten in the way, for who knows what reason.
10
7. Has the projections portion of the chart shown in Figure 6 been inappropriately downshifted, causing the early years to be out of agreement with the observations portion, in order to partially overlap the observed trend in later years and minimize the divergence?
00
Steven Goddard has something to say about this.
He thinks that is indeed the case.
http://stevengoddard.wordpress.com/2013/10/02/ipcc-if-the-data-doesnt-fit-the-theory-change-the-data/
00
why the Skeptics don’t unify and speak with one voice; to represent an official opposition to IPCC in the media?
11
Because we would be dismissed with derision as Conspiracy Theorists.
As Gengis Khan discovered, it is sometimes better to have an undisciplined horde of fast-moving independent soldiers with a common purpose, than it is to have a slow-moving disciplined army reliant on centralised command, and an immovable position.
40
As they say, there’s no such thing as a “stupid question”.
The NIPCC already exists. They have released several reports. Whether the media pays any attention to them is another issue.
20
ONLINE GLOBAL WARMING POLL TO VOTE IN…………
http://ninemsn.com.au/
Are you worried about global warming?
Results as at 1pm today…..
41426 no
64503 YES
GloBULL warming – THE BIGGEST SCAM IN HUMAN HISTORY !!!!
21
I saw the the results the other way around on Bolt blog. Can’t find the survey to confirm.
21
Apologies to all.
I Accidentally flipped the results.
They were :-
41426 yes
64503 NO
A thousand pardons….
50
39.1% worried.
Now break that down to
1. mildly worried
2. quite worried
3. very worried
4. can’t think about anything but (the Michael syndrome)
5. can’t think (Blackadder lapse)
6. pushed the wrong button.
Categories 4 & 5 would be in single figures.
51
I’m worried.
About the stupid, wasteful, economically irrational, environmentally evil, response to the natural climate variability !!
32
“39.1% worried.’
Green voters, plus most Labor voters.
32
“39.1% worried.”
or IQ < 80….
22
And don’t forget,
7. Dr Brain aka Sheldon (Look at me, I can do a linear fit, wow!)
32
Rereke Whakaaro –
from what little is known about the TPP, it sounds like a further erosion of national sovereignty, & would allow foreign corporations to bypass domestic laws, make it impossible for member states to regulate or ban risky financial products, etc. i would have thought there should have been a national debate long before now.
btw, the latest scare – true or false?
3 Oct: Guardian: Ocean acidification due to carbon emissions is at highest for 300m years
In the starkest warning yet of the threat to ocean health, the International Programme on the State of the Ocean (IPSO) said: “This [acidification] is unprecedented in the Earth’s known history. We are entering an unknown territory of marine ecosystem change, and exposing organisms to intolerable evolutionary pressure. The next mass extinction may have already begun.” It published its findings in the State of the Oceans report, collated every two years from global monitoring and other research studies.
Alex Rogers, professor of biology at Oxford University, said: “The health of the ocean is spiralling downwards far more rapidly than we had thought. We are seeing greater change, happening faster, and the effects are more imminent than previously anticipated. The situation should be of the gravest concern to everyone since everyone will be affected by changes in the ability of the ocean to support life on Earth.”…
http://www.theguardian.com/environment/2013/oct/03/ocean-acidification-carbon-dioxide-emissions-levels
3 Oct: BBC: Health of oceans ‘declining fast’
“Whilst terrestrial temperature increases may be experiencing a pause, the ocean continues to warm regardless. For the most part, however, the public and policymakers are failing to recognise – or choosing to ignore – the severity of the situation.”…
IPSO, funded by charitable foundations, is publishing a set of five papers based on workshops in 2011 and 2012 in partnership with the International Union for Conservation of Nature (IUCN’s) World Commission on Protected Areas.
The reports call for world governments to halt CO2 increase at 450ppm…
(Prof Dan Laffoley IUCN): “The UN climate report confirmed that the ocean is bearing the brunt of human-induced changes to our planet. These findings give us more cause for alarm – but also a roadmap for action. We must use it.”…
The co-coordinator, Prof Alex Rogers from Oxford University has been asked to advise the UN’s own oceans assessment but he told BBC News he had led the IPSO initiative because: “It’s important to have something which is completely independent in any way from state influence and to say things which experts in the field felt was really needed to be said.”…
http://www.bbc.co.uk/news/science-environment-24369244
40
Great! If oceans turn more alkaline it means they take in CO2, this means the oceans are cooling.
00
Sorry, that should be turn less alkaline
00
I can add a seventh question: Which of the following two projections does the IPCC consider more likely?
Scenario A
The IPCC undertakes to provide, on no more than two sides of A4 paper, a set of verifiable physical measurements considered as key indicators of the predictive skill of global climate models, alongside predicted values for these indicators. These are to include ranges of acceptable variance, such that if later observations fall outside of these ranges, then everybody can quickly decide for themselves whether the whole exercise was worth the candle.
Scenario B
Hell freezes over and the devil skis to work.
50
Hi stefan, I kind of touched on your question last week.
The people that question the new found religion are by and large individualists, free thinkers and are not easily unified.
Not being one for analogies, cooks in kitchens and chiefs and Indians comes to mind.
I discussed this in depth with a SA senator at the last Heartland Institute gig in Sydney where I had the pleasure of listening to David and Jo speak.
From that convo came about an organisation called CANdo but in reality, nothing influential came from the exercise.
I’m looking on with interest of the progress of the NIPCC as I believe it to be the best foil to duel with the Global Warming Doomsday Cult. Due to the entrenchment in the powers that be, a big ask.
Australia’s Bob Carter is at the forefront in this organisation and I believe if there is to be ‘unification’ this is the optimum vehicle to achieve such.
If anyone here wants a good read with a dose of satire, I recommend Taxing Air. A most entertaining read.
30
Woops, reply to comment #21.
00
“As one example, the rate of warming over the past 15 years (1998–2012; 0.05 [–0.05 to +0.15] °C per decade), which begins with a strong El Niño, is smaller than the rate calculated since 1951 (1951–2012; 0.12 [0.08 to 0.14] °C per decade)5. {2.4}”
What the IPCC are saying is that the result they are reporting is not statistically significant from zero since the confidence limits include zero. In other words they cannot say that there has been ANY rate of warming AT ALL. The 0.05 is merely noise. No warming has been detected within the confidence stated. It would appear that whoever wrote this does not understand basic metrology and basic uncertainty or they have sacrificed this on the altar of political expediency.
30
And if we skip the El Nino ocean cooling event (a release of energy to the atmosphere), we get this.
Maybe a slight, but insignificant rise before, and probably the start of a decrease in temperatures afterwards.
00
I’d like to offer a point of view here that might not be easy to see.
Pretend you are a serious Scientist with any of the groups which come under the IPCC umbrella.
You’re beginning to see how models have been, umm, massaged. You’re beginning to see how early records have been adjusted to make it look like recent records prove there is Warming/climate change. You’re beginning to see how some of your fellow Scientists are producing Science to suit the demand.
But, most of all, you’re beginning to have some questions as to how the media and politics have taken over the agenda.
What you see is that the overarching body you fall under, the IPCC, then brings out a pre release report to see how well what they all have to say is accepted, and then when there are some reservations about some of the things being said, they are covered up, or changed, or hidden withing that vastly huge overall body of work. Things like the original Fig. 1.4 mentioned above in Question 5. Things like Joanne mentioned in the earlier Thread about the probability factors of some catastrophes actually occurring.
So, you, (as the earlier Scientist I mentioned) see how the final report is changed to suit the agenda ….. not the Scientific agenda, but the political agenda, the media agenda, the rent seekers agenda. You cringe when some of those politicians, media reports etc translate what was originally said into what THEY want it to be. You cringe when a media report says that the heat is somehow hiding in the deep oceans, reported by a media talking head who knows how to read the news and look good doing it, but has no idea what he or she is actually talking about, shown graphically at this link at the 1.00 minute mark, where the talking head mentions that had that missing heat not sunk into the deep oceans, it would raise the air temperature by more than 200 degrees.
As a serious Scientist, things like this must make you doubt what you are actually doing, that it can be so changed to reflect something altogether different, that it’s blown out of all proportion, that it’s been hijacked by people who have little to no understanding what the reality is, that people you thought of as serious scientist have been coerced, and then given in, to show things that the hijackers (politics and media) want to be told.
There must be real scientists who had input into this who are now considering if they really do need to be associated with all this.
The trouble is that Science will be set back for generations when it all comes crashing down.
Tony.
80
“Pretend you are a serious Scientist with any of the groups which come under the IPCC umbrella.”
Does that count giving papers at ACCARNSI conference, and being paid by NCCARF on another contract ?
00
Thankfully I’ve managed to avoid getting hooked into the climate stuff.
00
Thanks Bob and Jo.
Question #4 has in it the answer to all the others and is expressed by the statement of the Netherlands. Namely “limiting the scope of the IPCC to human-induced climate change is undesirable, . . .”
When the problem is defined as the UN has defined it – human induced – , meaning use of fuels that produce gasses, to look for answers wherever that might lead would be contrary to the goals and purpose of the organization.
The journalists, or most of them, might be able to understand this issue, and I think it is “of a different kind” than the others.
Many of them might reach an understanding of some of the other issues – if they try. But most journalists will never understand the PDO. Bob has repeatedly explained this issue on his own and several other blogs. Still, it is often treated wrongly by folks that have read the material and should be trying to get it right.
30
Like Tony from Oz, I am truly concerned about the short and long term effects of Political Science on the much loved culture of being proud to be called Australian. This World Government Agenda is really very, very sinister, and needs to be exposed and eliminated with great vigour and purpose.
30
What part of Australian culture?
06
Thanks to Bob Brown, we now know that global governance is the real threat to genune democracy.
“For comprehensive Earth action, an all-of-the-Earth representative democracy is required. That is, a global parliament.” – Bob Brown
Let’s get to the core of the argument. It’s not about science anymore. It’s about a power takeover.
50
I had cause to re-read this article.
http://www.sciencenoise.org/uploads/Tom_Siegfried_Hill_Lecture_March_31_2009.pdf
Quote “… the criteria for news are almost exactly the criteria you choose to select false findings, not true ones.”
10
Because it is not as important as climate misleaders say that it is. It is only a small part of the total system where the extra energy accumulates, and is only temporary going on all available evidence. As has happened many times before.
Reality
#The 2001 to 2010 decade is the hottest on the instrumental record globally, over ocean, land and on every continent.
#2011 and 2012 are the hottest la nina affected years on record
#The long term trend in warming is unaffected by short term noise
http://data.giss.nasa.gov/gistemp/graphs_v3/Fig.A2.gif
http://static.berkeleyearth.org/img/annual-comparison-small.png
#1998 was affected by one of the strongest el ninos in 60 years
http://www.esrl.noaa.gov/psd/enso/mei/
[Reality? The long term trend started long before the emissions of CO2, and the trend hasn’t increased. So what if it was a record in our short records. That doesn’t tell us the cause, but the lack of correlation with CO2 (which you ignore) does. The fact that the models didn’t predict it, shows the models are wrong. It doesn’t matter how many times I tell you these same facts you will not listen, and have no response. But I will snip due to boredom, see below. Don’t expect to be able to keep repeating the same logical errors. – Jo]
[SNIP. Bored. You’ve mentioned that paper many many times on this blog, it has no relevance to the IPCC predictions, and you add nothing new. – Jo]
The oceans are still warming.
http://www.nodc.noaa.gov/OC5/3M_HEAT_CONTENT/
Sea levels are still rising
http://sealevel.colorado.edu/
The Arctic is still melting
http://nsidc.org/arcticseaicenews/files/2013/10/Figure3_Sept2013_trend-350×261.png
[Michael, your innumerate ability to turn global dynamics into a “yes/no” question impresses no one. All these factors are not warming enough, none of them tell us the cause. the models are wrong. – Jo]
and much more…
All of the above is ACTUAL DATA, NO MODELS, the science is not models they are merely projections of certain scenarios. The actual evidence is overwhelming and clear.
[Congrats. Actual DATA! But not the numbers that matter, nor the reasoning. You graduate from kindy, but no pass on preschool. And we are getting very bored. – Jo]
I could also present much solid science to show rising heat record trends, risis in extreme precipitation events (floods, drounght, hail, snow) and rising droughts. Read IPCC AR4 synthesis report, they never predicted a change in tornados or an increase in hurricanes. Basically all the actual evidence confirms and supports AGW and the science of the greenhouse effect and the carbon cycle.
Someone once said (cannot remember who) that science is not a democracy, it is a dictatorship and evidence is the dictator. The evidence is what I have posted above.
[That you think that “any warming” = global catastrophe caused by man-made emissions (which is about 27 steps short of being evidence) shows only how bad you are at reasoning. Michael you are wasting our time. Please stop. – Jo]
21
Michael the Realist, did you simply copy the comment you left at my blog…
http://bobtisdale.wordpress.com/2013/10/03/questions-the-media-should-be-asking-the-ipcc-the-hiatus-in-warming/#comment-13182
… and then paste it here?
Here’s my reply from my blog.
Michael the Realist says: “All of the above is ACTUAL DATA, NO MODELS, the science is not models they are merely projections of certain scenarios. The actual evidence is overwhelming and clear.”
Thanks for stopping by. Obviously, you’ve missed something very fundamental. Climate science has its basis in climate models. Without climate models, the IPCC cannot attribute global warming or climate change to manmade greenhouse gases.
As I’ve shown in numerous blog posts, the climate models are so flawed they cannot be used for attribution studies or for projections.
Have a nice day.
30
Question for you Mikey. Where is the “highest average elevation” of a mountain? At the bottom or the top?
And second question, once you get to the “highest average elevation”, how much more does the mountain rise?
Third question: Did your grammar school teacher ever teach you the difference between “warming” and “warm”?
00
The IPCC Juggernaut, the “BS* Cargo Cult“, (dubiously registered by the UN as a composite foreign flag vessel) has all the hallmarks of a fully laden supertanker. Even when all the power has been taken of the props the inertia will keep it moving for some time and distance until it finally stops. The IPPC, instead of taking note of the weather forecast for “increasing wind strength and damaging seas ahead”, has pushed the “taps” open to retain momentum in the hope of making it through to the next port despite heavy weather building up (sceptics throwing increasing waves of real world data over its bows).
And what of the cargo? The shipping manifest states as a heading in code: “when the ship comes in”. This translates into: “cargo holds chock full of untold wealth for the banksters, allied investors and other rent seekers”. Who pays for the fuel and cargo? The punters, of course, the true believers. They must pay “to bring the ship in”. In any religion, they always do.
The BS Cargo Cult isn’t going to stop any time soon. The heavy weather needs to increase into hurricane categories to either drive it aground on the reef of insurmountable evidence, and/or it sinks when the cargo shifts to one side. Too many rent seekers have their pensions and reputations bet on it that it will make it to port and unload, for them to call in the rescue service any time soon.
Some passengers jumped ship at the last port (AR4) to take their chances rather than face the storm ahead, before their reputation sinks with the ship. Free rent is one thing, but piracy is another. The BS Cargo Cult is heading into uncharted waters and are the crew aware many large icebergs lie ahead on the course they are tracking. Perhaps they had better tune into SportsBet to see what the odds are of making it to the next port with the hull still intact?
* Note: BS is a special category of vessel constructed entirely by the UN with the help of Green Labour. Standard shipping is designated SS (Sailing Ship or Steam Ship) in time honoured tradition. The UN has it’s own designation: “B…S..t Ship”
10
Ah – but according to Roger Harrabin, the BBC’s Environment Correspondent, he had a piece on their website recently about how the ‘oceans are dying’ (due to global warming, of course) and, due to all that CO2 which has suddenly dived to the deep oceans, they are also ‘acidifying’…
Well – he’s got to keep himself in a job, hasn’t he..?
10
The Kraken Ate the Global Warming!
40
Surely it’s Monckton in league with the Kraken that’s hiding the warming.
From Josh’s celebrated Walking the Planck trilogy.
40
No, nowadays when you sail the oceans you meet a charibdis here and there. Those are nasty ones sucking all our heat into the deep. The first one was seen By Odysseus after the Trojan war when he was doomed by Poseidon you know.
30
[…] blog of the day is Jo Nova, with a post by Bob Tisdale noting 6 questions the media should be asking the IPCC on […]
00
I have six questions for the IPCC.
1. How much money has been squandered by the IPCC?
A. Every penny they received.
2. Who benefited from their criminal activity?
A. Politicians and rent seekers.
3.Who was the most esteemed and renowned person on the IPCCs highly vaunted list of 2,000 plus?
A. The janitor.
4.Who was the most productive person on the IPCC roster?
A. The Janitor.
5. When was the last time the IPCC published an honest assessment report?
A. Never (see Q.1 and Q.2 above)
6. When will the IPCC complete its work?
A. When it is no longer funded and indictments are handed up!
41
Stealth IPCC supporters (please stop to carefully think about who they are and what luke-warmist reverse psychology they might be using) desperately want the public to believe natural multidecadal variations are “internal”.
It’s very informative observing just how stubbornly they stick to “internal” when the option to avoid controversy by simply using the less specific “natural” is both practical & easy.
Unfortunately for them, this is a severe vulnerability because it can be geometrically proven using earth rotation and atmospheric angular momentum data that they are patently wrong in the sense that comes from saying things like 2+2=5.
It’s not surprising to learn that stealth IPCC supporters are functionally innumerate.
—
Like usual, thanks for another excellent article Bob.
20
Peter Wacaroo, you are spot on; BUT if is under one voice – the ”Urban Sheep” expects answers from the opponents; now is more of, dogs are barking at the ppostman
00
I forwarded this to a science journalist I have known for awhile.
It will be interesting to see if he responds in any way.
Most AGW-obsessed media types are simply ignoring any questions of the AGW consensus, and especially ignoring any problems with the supporting facts.
My observation is that since climategate media has actually mostly deteriorated. The media refuses to cover skeptics, skeptical points, pretend there are no skeptical scientists, etc. They instead rely on repeating the AGW/IPCC mantra louder. They define ‘real scientist’ as ‘someone who agrees with AGW mantra’. So there are no AGW skeptics by definition.
Yet the AGW movement lost in Australia. In Canada. Is weakening in Europe. Is dead in Russia and laughed at in China.
Interesting times.
20
” Why has the IPCC chosen to hide the fact that climate models cannot simulate the hiatus in global warming?”
Very good question. The spaghetti graph is hiding the fact that none of the spaghetti lines does produce a 16 years flat line. They swing wildly up and down but none does have a warming stop for 16 years.
10
Re; Hiatus.
NOAA rules out a 15-year hiatus as being consistent with GCM’s. (BAMS Statement)
See the BAMS Statement at NOAA. You Tube; v=IHwvwcOOsn8 “BAMS statement from NOAA”; “The [computer model] simulations RULE OUT (at the 95% level) zero trends [in global temperatures] for intervals of 15 yr or more, suggesting that an observed absence of warming of this duration is needed to create a discrepancy with the expected present-day warming rate.”
Robert Holmes
00
[…] in my post Questions the Media Should Be Asking the IPCC – The Hiatus in Warming, which was cross posted at JoNova. Dana Nuccitelli once again added to the discussion with Why Curry, McIntyre, and Co. are Still […]
00
[…] the post Questions the Media Should Be Asking the IPCC – The Hiatus in Warming, which was also cross posted at Jo Nova’s blog. (I’ve updated the Figure numbers for this post.): 2. North Pacific Multidecadal […]
00
[…] of the post Questions the Media Should Be Asking the IPCC – The Hiatus in Warming, which was also cross posted at Jo Nova’s blog. (I’ve updated the Figure numbers for this post.): 2. North Pacific Multidecadal […]
00