Recent Posts
-
Monday
-
Sunday
-
UK facing devastating 36 degree heat — can’t decide whether to use air conditioners or rip them out
-
Saturday
-
Batteries failed on day One: A four day wind drought in South Australia wreaks havoc, high prices
-
Friday
-
The UN wants to be One World Government and it starts with a carbon tax on ships and planes
-
Thursday
-
What if Global Warming was just because something made the clouds go away…
-
Wednesday
-
Snowy 2.0 is the Trillion dollar Black Hole of Australia — sucking in energy, money, land, industrial relations, the dollar, our lifestyle
-
Tuesday
-
Monday
-
Winter Solstice
-
Saturday
-
We were throwing-renewable-energy away at record levels in 2025
-
Friday
-
Pauline Hanson, the centrist, just wants a free market in electricity, and an end to the renewable energy bribery
-
Thursday
-
Blame the Climate Yeti again for making your life more expensive! (It’s a smokescreen)
-
Wednesday
-
The Sunrise Project funneled $343 million from overseas to push net zero
-
Tuesday
-
Monday
-
Sunday
-
The US government has been secretly funding 120 dangerous biolabs around the world
-
Saturday
-
New report shows renewables are a drag on our national productivity
-
Friday
-
Thursday
-
Well, how convenient. AI data centers have arrived to be the fall guy for the Energy Minister
-
Wednesday
-
Billionaires are leaving the room with excuses — Bezos says “AI will solve climate crisis”
-
Tuesday
-
Monday
-
Sunday
-
The Craziest eco laws against Farmers. Let’s check that science…
-
Saturday
-
China cooks the carbon accounting books by 400 million tons
-
Friday
-
The Wind Power Puzzle (add more wind turbines and get the same output)
-
Thursday
-
To save the world, Cement Australia stops burning coal and burns trees instead
-
Wednesday
-
On Fire! US hunger for gas power so large, wait time for turbines blows out to 5+ years
-
Tuesday
-
Monday
-
Sunday
-
Saturday
-
Perth event Saturday May 30th: Green Greed and the Grid
-
Catastrophic warming already happened in Antarctica 130,000 years ago
-
Friday
|
 By Jo Nova By Jo Nova
The World’s Renewables Crash-Test-Dummy has officially set new magical emissions-reductions-targets. It’s just a different shade of impossible, so nothing’s changed. But the labels on the staircase to Green Heaven have switched from 43% to 62%. The UN and President Xi will be happy.
It won’t change world temperatures but it might be enough to bribe the UN with to “win” the Olympics of Climate Conferences — the junket to end all junkets. The annual private jet party of bureaucratic celebrities.
When our PM was asked why Australia should set targets for global weather control when the three biggest countries on Earth are not, he whipped out a “fun fact” to run a nation by — as Graham Lloyd noticed in The Australian.
[Anthony Albanese] hit out at Coalition MPs who argue Australia should not adopt ambitious targets when there was a lack of action from big emitters the US, China and India.
“The amount of wind and solar power under construction in China is now nearly twice as much as the rest of the world combined. Just a fun fact there,” he said.
It’s almost like the PM is managing the country like it’s his Tik Tok account. Sadly for him (worse for us) it’s like a conversation with a troll. Before we spend a trillion dollars, and fry the national grid, we’d hope Anthony Albanese could answer our questions. Just because China is installing lots of useless wind and solar plants, doesn’t mean we should too. (They’re also cutting Taiwan’s subsea cables, leaking bioweapons, and harvesting organs from prisoners. Just say “No”. OK? ) China has also sacked one third of their solar manufacturing workforce. Perhaps they’re just installing all the left over solar panels they can’t sell to anyone?
China might be installing all that wind and solar, but their emissions are off with a rocket
Doesn’t that matter, and isn’t it sort of the whole point? (And will the ABC ever ask?)

Lloyd points out that China’s emissions grew by more than Australia’s total annual output.
Looking at all the energy sources used by China we get a clue why their emissions are not falling:

Likewise, here’s Australia’s total energy use by source in TWh on the same scale as China’s:

These graphs include all energy sources including industry and transport and not just electricity, that’s why oil is higher than coal in Australia.
For the record, assuming the numbers are accurate (though I don’t know why we would) China has 30 times as much wind power, and 19 times as much solar power as Australia does — and burns 61 times as much coal. The figures below are TWh for China and Australia from OWID.
| … |
Fuel source |
China |
Australia |
Ratio |
| … |
Coal |
25,599 |
423 |
61 |
|
Oil |
8,964 |
620 |
15 |
|
Gas |
4,344 |
370 |
11 |
|
Hydro |
3,303 |
37 |
107 |
|
Wind |
2,432 |
878 |
30 |
|
Solar |
2,046 |
123 |
19 |
|
Nuclear |
1,099 |
– |
|
|
Biofuels |
37 |
1 |
29 |
|
Other renewables |
652 |
9 |
70 |
China also has 107 times as much hydropower. (And we thought the Snowy Hydro Scheme was big. )
But seriously, cherry-picked glib inanities is hardly a way to run a country. It is an insults to hardworking Australians. If the media and opposition hounded him on the sheer pointlessness of our Net Zero piety, he would have never been elected.
That’s why billionaires buy the media. isn’t it?
RELATED POSTS:
_______________________
REFERENCES
OWID and the Energy Institute – Statistical Review of World Energy (2025)
Image by Дмитрий Бирюков from Pixabay
10 out of 10 based on 87 ratings
9.2 out of 10 based on 13 ratings
By Jo Nova
The world backs away slowly:
China and India were never there with Net Zero, the US was, then wasn’t, Canada appeared to be, but in order to be electable, Mark Carney dropped the country’s carbon tax the minute he was appointed PM (because his opponent, Pierre Poilievre had made repealing the federal carbon tax a central plank of his platform). The President of Mexico was a PhD in energy engineering and environmental policy, but now talks about “energy security” and boosting oil and gas production. Meanwhile New Zealand has reversed the oil and gas ban, encourages mining, and will delay the pricing of agricultural emissions by five years.
With impeccable timing, just as Australia announces a new more impossible target, Germany and France are squabbling over the EU target, and the EU will now miss the UN deadline.
By Seneca ESG
The European Union is at risk of missing a key United Nations deadline to submit updated climate targets, as internal disagreements stall progress on a proposed emissions reduction goal for 2040. The bloc had aimed to cut emissions by approximately 90% compared to 1990 levels by 2040, forming a critical milestone on the path to net-zero by 2050.
However, several member states—most notably France, Italy, and Poland—have raised concerns over the economic impact and feasibility of such an ambitious target. These objections led to the postponement of a planned Environment Council vote, originally scheduled for mid-September. As a result, EU leaders are expected to revisit the issue at a high-level summit in October.
In the interim, the EU is considering a “statement of intent” that outlines a potential emissions reduction range of 66.3% to 72.5% by 2035, relative to 1990 level.
France has been leading the way to delay the announcement, especially of the 2040 target.
Reuters Sept 2: In a closed-door meeting of EU diplomats on Tuesday, France said the 2040 target would not be ready for ministers to approve this month, two diplomats familiar with the talks told Reuters. France is mired in a domestic political crisis, with the government facing potential collapse in a confidence vote next week. A French diplomatic source said the government had reiterated its concerns on whether the 2040 climate goal is feasible…
Even the New York Times, Masthead for The Blob, is lamenting the collapse of the Paris agreement hopes and dreams.
There is a tiny bit of soul-searching here (but not much). Mostly this is just nostalgia.
by David Wallace-Wells, New York Times
Ten years ago this fall, scientists and diplomats from 195 countries gathered in Le Bourget, just north of Paris, and hammered out a plan to save the world. … Paris wasn’t just a brief flare of climate optimism. To many, it looked like the promise of a whole new era…
Lo, Climate Action filled a spiritual void (and you thought it was supposed to stop storms?)
But with the global war on terror long since dissipated into tragic farce and a new Cold War not yet well crystallized in the public imagination, the American-led global order seemed to be missing some sense of purpose, too. Here came the existential project of climate action to fill that semi-spiritual void, at least for some of those who felt it.
Now almost everywhere we look climate alarm has become “complacency and indifference”…
To our north, the former central banker Mark Carney — whose 2015 warnings about the financial risks from climate change helped set the stage for Paris by alarming the world’s banking elite — became prime minister of Canada in March and as his very first act in office struck down the country’s carbon tax, before storming to a landslide victory in the April election. To our south, President Claudia Sheinbaum of Mexico, a former climate scientist, has invoked the principle of “energy sovereignty” and boasted of booming oil and gas production in her country — and enjoys one of the highest approval ratings of any elected leader anywhere in the world. Almost everywhere you look, the spike of climate alarm that followed Paris has given way to something its supporters might describe as climate moderation but which critics would call complacency or indifference.
Progressives long believed that climate politics was a kind of tug of war, in which tugging harder would pull many on the other side over the line into grudging support. To some degree, that is what happened after Paris, with advocates shifting the Overton window pretty dramatically and winning meaningful gains along the way.
But it also looks a bit as if they pulled so hard they collapsed in disarray.
The author, David Wells-Wallace, spends the second half of the article pretending that renewables will still take over the grid (we’re installing so many, he says!). He doesn’t realize how little fossil fuel energy they are displacing.
Scott Adams, too, wonders where the climate hysteria has gone?
Scott Adams, the Dilbert cartoonist remarks — “the climate change hysteria has gone away.”
He quotes someone called coddled affluent professional — who has a theory on why climate change hysteria has gone. He wonders if it was all astroturfed because billionaires were funding hysteria? And theorizes that now that the climate spigot has dried up, the billionaires can’t be bothered raising hell. Adams points out that since the government took away the big money, there ought to be more climate angst about the world, not less — unless, of course, the degree of complaining was related to how much money they could get out of the issue.
— ht Tom Nelson and Climate Depot
For the moment, the last stand of pure climate hysteria left in the world is in Australia.
10 out of 10 based on 85 ratings
9.1 out of 10 based on 16 ratings
By Jo Nova
Andrew Hastie has “Nailed his colors to the mast”
Since belief in Climate Change is maintained through bullying and coercion rather than evidence, it takes someone brave to stand up to it.
The Greens can be intimidating, but in Andrew Hastie’s last career, he took on the Taliban, so being called a climate denier is only so scary.
The Liberal Party has fallen to 27% primary vote — a dismal, perhaps death-spiral position, mirroring the UK Tories. Yet Trump won in the US by calling Net Zero a hoax and dumping it entirely. And Nigel Farage is storming up the polls in the UK — breaking the ancient two-party system.
The last time the Liberals stormed an election in Australia was when Tony Abbott won 90 seats promising to Axe the (Carbon) Tax. Polls show 83% of Australians don’t like higher emissions targets. They also show half of Australia doesn’t want to pay a single cent on Net Zero targets. Even the Labor Party hid their new bigger (stupider) Net Zero target during the election because they know the voters don’t want it.
Yet despite all these radioactive hot electoral signs, The Opposition Leader Sussan Ley has dithered and delayed on Net Zero, putting off the decision until next year after a long review.
Andrew Hastie is brave enough to stand up to the namecalling bullies, and can’t bear waiting any longer:
 ARC Forum, Andrew Hastie, Flickr The home affairs spokesman issued the ultimatum on ABC radio in Perth on Monday, just days after the sacking of senator Jacinta Nampijinpa Price from the front bench.
When asked what he would do if Opposition Leader Sussan Ley attached the Coalition to net zero commitments, the Western Australian MP responded: “That leaves me without a job”.
“I’ve nailed my colours to the mast,” he told ABC Radio Perth.
Predictably, The Age called him a dinosaur — set for extinction. Meanwhile the feminists are baffled that any conservative MP would dare undermine a female leader “and hope to get elected”, as if voters wake up thinking they can’t afford steak for dinner but they need more female politicians in their lives.
The sexist take is demeaning, as if Australian women are so small-minded they might vote for X or Y chromosomes rather than cheaper electricity bills, or affordable homes.
But at least one senior member of the Liberal Party is warning of a mass exodus over Net Zero without some conditions.
Phillip Coorey, Australian Financial Review
Opposition education spokesman Jonathon Duniam says there could be a “mass exodus” from Sussan Ley’s frontbench unless the Coalition dumps or qualifies its support for net zero emissions by 2050.
On Monday night, Hastie told ABC radio it would be untenable for him to stay on the frontbench should the Coalition adhere to its position on net zero. “My primary mission in politics is to build a stronger, more secure, more competitive Australia,” he said. “Energy security is a vital input into that, so that’s my bottom line. I’ve nailed my colours to the mast. “I said that net zero policy is a straitjacket for our economy and our country, and I believe that. I’m actually quite passionate about it.”
The only solid Liberal governments in Australian states left are, as Chris Ulmann points out, in Queensland and the Northern Territory, where they are paired with the Nationals and not pandering to the left. (The NT government will not implement their Net Zero Target. And Queensland has axed their renewable energy targets, and vowed to keep coal plants running for another decade. )
Something has to give
Craig Kelly, former Liberal MP, says it could be the start of a whole new Australian conservative party and lays out his vision:
Here we go, the planets are aligning.
With too many bedwetters, the Liberal Party doesn’t have courage nor the troops to take on the Net Zero scam. Here’s how it could play out.
-
-
-
-
- Hastie resigns over the Liberal Party’s weakness on fighting Net Zero.
- At least half a dozen others Liberals join him.
- Hastie then announces a new party and invites all other Liberals to join – a few more jump the sinking Liberal Party ship.
- There is then a convention (like Menzies held in Albury in December 1944) of the breakaway Liberals and all smaller like minded parties including; the Nationals, One Nation, Libertarians, Family First, Katters Australia, Rennick’s People & United Australia.
- Policy platforms are determined and they vote to make Andrew Hastie the leader and Jacinta Price deputy leader of new united force to take on Labor at the 2028 election.
- Sitting MPs and Senators that join are automatically preselected, and nominations are called for candidates for all 150 lower house seats and the senate positions in every state – with preselections to be held by democratic primary.
- The left over Liberals fade in obscurity with several joining the Teals.
- The new entity storms the nation, and hits the lead in polls (like Reform in the UK) and smashes Labor at the 2028 Federal election.
- Net Zero is scrapped, Migration is cut, freedom of speech guaranteed, pro-family tax reforms introduced, and covid royal commissions commenced.
- Australia is saved.
Bear in mind, Hastie chose not to contest the leadership in May after the election, and has young children, so he may not be trying to take over the leadership or split the party — he might just want to give Sussan Ley a reason she can’t ignore to commit to a stance that most of Australia wants.
Right now here in Crazy Land, the government wants to bankrupt the nation to fiddle with the weather in 2100, and the Opposition isn’t even opposing it.
A culture war needs a fighter.
h/t El Gordo, David B
9.9 out of 10 based on 107 ratings
8.4 out of 10 based on 11 ratings

By Jo Nova
It’s a Pantomine from beginning to end — the fakery never ends
Australia’s National Climate Risk Assessment has dropped on us yesterday like a mass-produced propaganda-bomb. Life and death depends upon “the science”, but the intense, dire and secret climate modeling was mysteriously delayed last month for no reason (except to get some spooky headlines), whereupon the Greens jumped up and down to get it released, and then patted themselves on the back saying Labor caved in. Yes, indeedy, the Government put out the report with perfect PR timing a few days before they plan to tell us how they are raising our emissions target from impossible to astronomical. If they released the “science” a month ago, people would have more time to pick apart the 274 pages of propaganda (or even read it).
Science is just a marketing tool for Big Government now, and the document is a fishing mission for catastrophe.
We know it’s not science because everything is 100% bad. It’s the purity that gives it away. In the real world, there are always trade-offs.
It’s all cost and no benefit
The document is a risk assessment which calculates the cost of inaction, but not the cost of action. Not surprisingly, the cost of inaction is always going to be “higher” (higher than nothing). It was apparently, exactly what the Minister wanted:
“One thing that is very clear from this climate assessment is that our whole country has a lot at stake,” Bowen said. “The cost of inaction will always outweigh the cost of action.” — The BBC
Nobody knows what the cost is, not the Minister of the Department of Better Weather and Energy. Though one guesstimate from a group called Net Zero Australia in 2023 tossed out numbers like $1.5 trillion by 2030 and $7-$9 trillion by 2050. That’s a lot of cost savings we need to make to make action make sense. Grown ups would like to discuss this, perhaps?
It’s all deaths and no lives saved
Heat waves will kill more people, but somehow warmer winters won’t reduce any deaths, even though moderate winter cold kills 6 times as many people as summer heat does.
 Attributable fraction of deaths: Heat, cold and temperature variability together resulted in 42,414 deaths during the study period, accounting for about 6.0% of all deaths. Most of attributable deaths were due to cold (61.4%), and noticeably, contribution from temperature variability (28.0%) was greater than that from heat (10.6%). (Cheng et al) Heatwave mortality will increase by 444% in Sydney if the world warms by 3°C the report tells us, with no mention of the word “air-conditioning”.
If reckless spending to stop-storms-in-2100 makes energy unaffordable, heatwave mortality will increase even if the world doesn’t warm at all. No one will be able to afford air-conditioning.
The only mention of “benefits” in the whole document is that a few areas might benefit from reduced frosts — not that our expert modelers can say which areas, or which seasons that will happen in.
Like advertising, “everyone” will be better off if they just buy this weather controlling widget.
The 72-page report – released days before the government announces its emissions reduction targets for 2035 – found that no Australian community will be immune from climate risks that will be “cascading, compounding and concurrent”. — The BBC
The 274 page blockbuster has a nifty 74 page overview for anyone who only has a day or two to devote to the combinations and variations of modeled imaginary catastrophe. There’s nothing there that we haven’t seen a million times before.
ht Old Ozzie, Neville, another ian.
10 out of 10 based on 105 ratings
9.4 out of 10 based on 15 ratings
8.7 out of 10 based on 25 ratings
8.8 out of 10 based on 23 ratings
8.9 out of 10 based on 22 ratings
 Greens are best friends of the Bankers By Jo Nova
It hurts the Greens when skepticism rises in polls and they have no good answers
It must drive them wild when backward redneck farmers refuse to see the bat killing wind turbines as the shiny totems against bad weather. The ingratitude! (How could they not like high voltage lines!)
So The Greens set up a Senate Inquiry on “Information Integrity on Climate Change and Energy” convinced that there are buckets of money washing around for astroturfing farmers and paid jobs for bloggers and commentators to spread climate misinformation.
It’s as if they think they’re only losing the battle because voters are too stupid to figure out the truth if they accidentally hear both sides of the argument. They have to be fed a pure stream of “the green information”. And thus the caring compassionate Greens turn out to be arrogant, condescending and profoundly undemocratic status seekers yet again.
The Greens recite their own religious hymn:
“For decades, vested interests have been waging a global war of disinformation against the clean energy transition, including environmental and climate legislation, and these vested interests have recently achieved significant political success in nations such as the US.
The craziest thing is that after “climate change” approved agitprop has been shoveled out through every media outlet and school for twenty years, the Greens can still pretend that somehow a few dissenting voices can confuse half the country.
They fool themselves that they are the little guys bravely fighting the Big-Oil powers of the world, while they hold hands with Big Bankers and One World Government wannabees. If it’s honest, this inquiry to follow the money will lead right back to their own team. Nearly all the vested interests in this debate are stacked 6 feet high on the side of the Greens. They stand with The United Nations, global academia, the media, the bankers, the pension funds, industrial wind and solar power, the battery manufacturers, the climate modelers, the Bureaus of Meteorology, and to round it all off, the Chinese Communist Party too.
Speaking of bankers, at one point GFANZ — the Glasgow Financial Alliance for Net Zero had 500 members which controlled some $130 trillion dollars of assets. There is no bigger “vested interest” in the world than 500 financial houses, insurance groups and asset managers. They were managing funds six times larger than the GDP of the most powerful nation on Earth. They openly colluded to change energy policy around the world, despite the wishes of voters, and to undermine the free market. It looked, acted, and smelled like a cartel. So much so, that 19 Republican states in the US launched legal proceedings on antitrust and fiduciary duty. At that point many of the banking houses backed away obviously recognizing the legal danger they were in.
UPDATE: My submission has been accepted and published at #155.
Submissions close today, (Friday 12th September.) My draft follows with rough edges. I will polish later, thanks for suggestions…
______________________________________________________________________________________
Select Committee on Information Integrity on Climate Change and Energy
The Terms of Reference
A Draft submission from Jo Nova
1.a. “the prevalence of, motivations behind and impacts of misinformation and disinformation related to climate change and energy;“
The Prevalence of misinformation is rife — mostly through lies-by-omission
The most powerful and pervasive misinformation is that of the lie of omission. Australian people have been subject to misinformation in the form of half-truths and the suppression of relevant facts, without the context that renders the point irrelevant, minor or not so frightening.
- Water is the most powerful greenhouse gas — absorbing across a broader range, and 10 to 100 times more abundant. The word games pleading that it is “not a driver” are mere assertion based on climate models that we know don’t work.
- The world was hotter 5 to 10,000 years ago in the Holocene, and 120,000 years ago during the Eemian, and for most of the last 500 million years. Life on Earth evolved during hotter periods that lasted hundreds of millions of years.
- Seas have been falling for 7,000 years since the Holocene optimum. Australian seas were 1 to 1.5m higher. (Lewis et al)
- Temperatures of 50°C were recorded all over Australia in the 1800s. (Trove, NLA) The BOM would say these were not done on certified official equipment (because there was none at the time) but this is Australian history, and some of these temperatures were recorded at observatories by trained staff. Shouldn’t Australians at least know this?
- Most Pacific Islands have grown in size in the last 50 years. 89% of 709 Pacific Islands were found to be the same in size or growing (Duvat et al). There are no inhabited islands, not one, that is smaller now than it was in 1970. (Kench et al).
- Nobel Prize winners and astronauts are silenced? While the media will tell us a high school activist’s opinion on climate change they would not phone up and interview Nobel Prize winners who were skeptics — like Ivar Gievar (now deceased), Robert Laughlin, or John Clauser. They would not talk to men who walked on the moon and ask them why they were skeptical. Isn’t the opinion of Buzz Aldrin, Harrison Schmidt, and Charles Duke worthy of reporting?
For thirty years all media outlets have misinformed Australians about what science is:
The media have given Australians the impression that science is done by a kind of religious “expert” decree which must not be questioned, when the truth is the exact opposite. Tragically, the CSIRO, and most of our universities have sat quietly by allowing this (they have a vested interest and motivation in doing so, don’t they?)
- Science is not done by consensus. Professors of Science don’t vote for gravity. The truth is revealed through observations and measurements, not via opinion polls.
- The science is not “settled” — if it was, we’d know if next year would have a barbecue summer, or wet winter. We’d be able to predict El Niños & La Niñas. There would be only one Climate model, and expert modelers would not be “surprised” that the Antarctic sea ice is suddenly melting, while the Arctic hasn’t shrunk in the last 20 years. They wouldn’t have said that warming in the upper troposphere was a “fingerprint” of man-made climate change only to find that 28 million weather balloons showed the fingerprint wasn’t there.
- All scientific theories must be falsifiable. If a theory can never be proven wrong, it isn’t science but religion. Both warm and cold extremes “prove” climate change, as does both droughts and floods, more cyclones, less cyclones, faster and slower winds, more sea ice, less sea ice, and also completely stable sea ice for twenty years.
- Peer Review is neither essential for science nor proof of anything. Einstein’s great works were not peer reviewed.
- It’s not science unless all methods, and all data are published in full. The Bureau of Meteorology homogenizes temperatures by an in-house subjective process that they admit they cannot explain to outsiders. (The BOM Technical Advisory Forum report. 2015) This is more like a medieval guild than a scientific institute. They will not publish the side-by-side temperatures recorded with two different types of thermometers (electronic sensors versus liquid in glass) even under FOI, and it shouldn’t require an FOI in the first place.
- Wind and solar power are not cheap in any meaningful sense — there are few uses of intermittent or random electricity, so it is misinformation to report short term prices for wind and solar as if they are comparable to prices for reliable stable supply. Australians need to know the cost of 24 hour reliable electricity, which is what they have been paying for, for decades. This includes storage, back-up, frequency stability, transmission, and network costs. Since intermittent supply
The motivations are obvious (but unreported)
There are many vested interests in the climate debate and most of them profit from promoting Catastrophic Anthropogenic Climate Change.
Bankers can act as brokers in buying and selling carbon credits (but only if the governments force people to buy them). If they are also heavily invested in renewables, or EVs, or insurance, or want to do business in China, they have many ways to profit from climate change fears and the quest for Net Zero.
-
Global finance: GFANZ (Glasgow Financial Alliance for Net Zero) claimed in 2021 to represent 500 firms with US $130 trillion in assets under management — six times larger than the GDP of the USA. While these funds were not invested in “climate change” per se, the point of the GFANZ group was to use their market power to advance Net Zero policies and industries. This dwarfs any fossil fuel lobby. As I reported at the time, Scott Morrison and Josh Frydenberg admitted they pushed through a Net Zero Target for Australia in November 2021, not because Australians voted for it, but because the bankers threatened to raise interest rates by 1.5% which would cause market chaos, and raise payments on national debt.
- The Global Carbon Market was worth $909 billion USD two years ago. Several forecasts (e.g. in the carbon credit market) project values of ~US$2 trillion by 2030 under current growth trajectories.(Fairfield )
-
The Australian government: The Clean Energy Finance Corporation (CEFC) has committed over $18 billion in taxpayer-backed funds, heavily tilted to wind, solar, and storage. ARENA (Australian Renewable Energy Agency) has provided over $2 billion in grants. If it turned out that there was no catastrophe, many careers would be lost, and politicians reputations ruined.
-
Universities: Billions in research grants flow to projects aligned with catastrophic climate messaging, while skeptical proposals receive effectively zero support. Skeptical researchers are often sacked for speaking out (see Peter Ridd or exiled like Prof Bob Carter and Murry Salby). In addition, University superannuation funds are often invested in renewable or green funds, and thus, benefit from promoting climate fears. This is a direct conflict of interest.
- Unisuper — is the dedicated super fund for the higher education and research sector in Australia.It manages over $135 billion (as of 2024) for ~600,000 members (university staff, researchers, etc.). UniSuper publicly states its commitment to net zero emissions by 2050 across its portfolio, with interim 2030 targets. It has invested in renewable energy developers, infrastructure, and green bonds. Example: In 2021 UniSuper joined other big funds in Climate Action 100+, a global investor initiative pressuring companies to decarbonise.
- And there is also AustralianSuper, HESTA, and AwareSuper all who have made NetZero pledges.
-
Subsidies: In the last ten years renewable subsidies are estimated to add up to $29 billion (CIS). But the total burden on households is much larger. Dr Alan Moran’s broader estimate is $1,300 per household or $13 billion a year.
- China is also a supermassive vested interest that benefits from the climate fear campaign — selling 80% of the worlds solar PV, much of the wind power, and more than half of the EVs. It is not surprising that China has funded eco-lawfare suits in the USA which would impose burdens on US Energy companies, making them less competitive and indirectly making US manufacturing less competitive due to it’s reliance on energy that is not so cheap. Chinese money found it’s way into New York activist groups in the US to push for the climate “SuperFund Law” which may force US Companies to pay $75 billion in climate damages to New York. Meanwhile the Chinese branch of the Energy Foundation has funnelled $12 million to US universities and non-profits to promote green energy and tax reform since 2020.
There is a large asymmetry in motivation — while fossil fuels are in high long term demand which is remarkably inelastic, there is only a small voluntary market for carbon credits, wind power, solar power, or green steel as a fashion item. Without the theory of Catastrophic Anthropogenic Climate Change the subsidies, entire profit margin, even industry would evaporate overnight. Hence the motivation of people 100% dependent on the theory is a life or death type of commitment. Despite twenty years of subsidies, global coal production and use is still rising. Coal companies don’t need to advertise to find customers.
The United Nations gains power, funding, and status with annual giant Olympic size junckets. Every year between 10,000 and 100,000 people fly to meetings that last as long as two weeks. The UN wrings money and favours out of states by threatening to rate their wilderness or reefs as “endangered” and demanding they sacrifice part of their economic advantage to satisfy the
On 30 July 2025, the Senate appointed a select committee, to be known as the Select Committee on Information Integrity on Climate Change and Energy, to inquire into the prevalence and impacts of misinformation and disinformation which relates to climate change and energy.
The committee is due to present its final report by Wednesday, 4 February 2026.
The closing date for submissions is Friday, 12 September 2025.
Committee Secretariat contact:
Select Committee on Information Integrity on Climate Change and Energy
Department of the Senate
PO Box 6100
Parliament House
Canberra ACT 2600
Phone: +61 2 6277 3024
[email protected]
REFERENCES
BOM Technical Advisory Forum report. 2015 — http://www.bom.gov.au/climate/change/acorn-sat/documents/2015_TAF_report.pdf
Duvat, V. K. E. (2018). A global assessment of atoll island planform changes over the past decades. Wiley Interdisciplinary Reviews: Climate Change, e557. doi:10.1002/wcc.557
FairField Market Research, https://www.fairfieldmarketresearch.com/report/carbon-credit-market, August 2023.
Kench, P.S., Liang, C., Ford, M.R. et al. (2023) Reef islands have continually adjusted to environmental change over the past two millennia. Nat Commun 14, 508 doi.org/10.1038/s41467-023-36171-2
Lewis, S.E., et al., Post-glacial sea-level changes around the Australian margin: a review, Quaternary Science Reviews (2012), http://dx.doi.org/10.1016/j.quascirev.2012.09.006 [abstract].
Trove (NLA) — For exact references to the many 50C recorded days and locations see the list at https://joannenova.com.au/2019/01/forgotten-history-50-degrees-everywhere-right-across-australia-in-the-1800s/
Wu, Michael (2024) Counting the cost: Subsidies for Renewable Energy, Analysis Paper 70, Centre for Independent Studies (CIS)
10 out of 10 based on 103 ratings
8.1 out of 10 based on 15 ratings
By Jo Nova
The latest Times polling shows British people have had enough with paying more for electricity bills, taxes and meat in order to change the weather.
Fully 87% said they would not be willing to pay more for domestic electricity or heating bills. 70% said they didn’t want higher taxes, and almost the same number didn’t want to pay more for meat or dairy either.
In a democracy, these would be the easy winners. Rarely on key topics are numbers so far above 50%. Yet somehow, some way, the UK conservative party completely missed the big 80:20 issues and lost the election, and then the Australian conservatives did too.
The EV thrill is over for the British:
The biggest mood shift was away from electric vehicles, and in polling terms, it was seismic. Sometime in the last four years nearly a quarter of Britons changed their mind about whether the government should ban petrol and diesel cars. Between 2021 and now polls shifted from 51% supporting the idea (what were they thinking?) to 58% oppose.
Australian politicians should note how brief the infatuation with EV’s really was. Enthusiasm might be over here before it even starts.

The number of Britons who think the dangers of global warming have been exaggerated has jumped by more than 50 per cent in the past four years, new research for The Times reveals today.
One in four voters now believe that concerns over climate change are not as real as scientists have said, amid growing public concern at the cost of the government’s net zero policies.
Four years ago climate change was identified as the fourth most important issue facing the country ahead of immigration and asylum, education and crime.
Now climate change has fallen right down the list of the public concerns while there has been a marked increase in climate scepticism.
On EV’s the pendulum has swung:
The Money question: Which if any of the following would you be willing to see increase in cost in order to combat climate change?

Hands-up?! Who believes in climate change?
Somehow 59% of people still say they “believe” in climate change, but the question has become a mindless cheerleading chant. What does it mean to “believe”? Only 16 per cent of voters said they would be prepared to pay higher gas bills to encourage the switch to electricity. It means nearly half the country were able to say “yes they believe in climate change” and also tick the box “‘Not willing to pay higher gas bills”. Perhaps they think mankind is doing something to the climate, but either they like the warmer weather and don’t want to solve climate change, or they don’t believe their gas bill will achieve anything.
Or, perhaps they just know they are supposed to say “I believe in climate change” even if they don’t. It’s become a mantra.
REFERENCES
The Times — Revealed: Global warming exaggerated, say soaring number of Britons
Yougov poll results: https://d3nkl3psvxxpe9.cloudfront.net/documents/TheTimes_Results_250604_w.pdf
https://d3nkl3psvxxpe9.cloudfront.net/documents/Eurotrack_ClimateChange_Apr25_w.pdf
10 out of 10 based on 88 ratings
 Vale Charlie Kirk, assassinated today because he spoke for The People, against The Blob. It is a pivotal and dark moment in US History. Vale Charlie Kirk, assassinated today because he spoke for The People, against The Blob. It is a pivotal and dark moment in US History.
The WhiteHouse declared, In Memory of Charlie Kirk — flags will be flown at half staff across the US.
The parasites who had no answer to him can only respond with bullets.
9.9 out of 10 based on 50 ratings
By Jo Nova
That didn’t last long
It was only two years ago that BHP announced “Operational Decarbonisation”. They would build 550MW of wind solar and battery storage in the Pilbara region of WA. It was part of a $4 billion global budget for electrifying trucks and reducing carbon emissions. It was all so ambitious — they set a goal of a 30 per cent reduction by 2030, from 2020 levels, and net zero by 2050. The “Responsible Energy” message is still starring all over their home page.
Their diesel haul trucks use 1.5 billion litres of fuel each year, and they were keen to replace them with electric vehicles, which, they said would “save money”. But it’s all fallen in a hole already. The $4 billion USD global plan has shrunk to half a billion — a savage 88% cut. The new Pilbara solar and wind turbines were quietly shelved late last year (perhaps after Donald Trump won) but the news is only being shared now.
Meanwhile the electric trucks haven’t been invented fast enough so they’ve been delayed indefinitely.
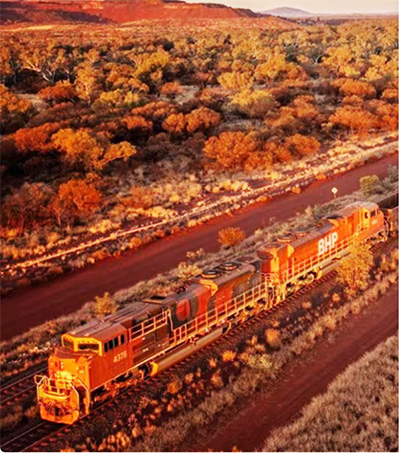 BHP Home page Daniel Mercer, ABC
Mining giant BHP has dumped plans to build a major renewable energy project at its flagship iron ore operations, sparking claims the company is slowly walking away from efforts to decarbonise.
In 2023, BHP announced it would spend about $US2 billion ($3 billion) building more than 500 megawatts of large-scale wind, solar and battery projects to clean up and electrify its iron ore business in Western Australia’s Pilbara region.
BHP estimated the project would cut greenhouse gas emissions from its “inland” iron ore division by 15 per cent by the end of the decade and reduce overall emissions by about 2 per cent.
But internal BHP documents seen by the ABC show the miner binned the plans last year because of budget cuts.
“Due to capital constraints, the project has ceased,” BHP noted in one document seen by the ABC.
Tim Buckley of Climate Energy Finance finds the “capital constraints” hard to believe (which only makes it more interesting). He says the company is “awash with money”, “booking 50 per cent annual returns on capital…”. If they have the cash but still don’t want to buy the Green Dream, it suggests maybe BHP management can read the writing on the wall — perhaps they realize the great renewables bubble is ending, the subsidies are winding up, and they don’t want to be left holding the can? And obviously, none of it was going to save money, or they’d be doing it anyway.
Wow — that’s some flip — an 88% reduction in funding for green energy?
It’s as if they’ve lost their green mojo:
The cancellation of the so-called ‘Inland Solar PV’ project comes amid what one analyst described as a “cooling” by BHP on broader decarbonisation efforts.
In its recent annual report, the mining colossus revealed it had pared back to $US500 million ($759 million) — from $US4 billion previously — the amount to be spent on “operational decarbonisation” by the end of the decade.
But the sudden abandonment of the electric truck plan begs the question — were they really expecting trucks to improve that much or were they expecting more subsidies to make it make sense?
Central to the reduction was BHP’s decision to defer investing in electric truck and train haulage technology that could slash the company’s diesel use. The miner explained the deferral had been prompted by delays in the development of suitable electric technology that could replace conventional diesel varieties.
Solar grows to 30 or 40% then microgrid costs rise exponentially
These remote mining operations in WA are almost all microgrids — each one is a standalone energy system and a feasibility study on renewables. These projects cannot access the main electricity grid more than 1,000 km south, and they run their own small gas turbine — in BHP’s case a 190MW generator. Like Alice Springs, like Onslow and King and Flinders Island.
The most interesting comments came from one funds manager who reveals that many companies are having the same trouble as BHP — they add in solar power until they reach 30 to 40 percent and then the costs rise exponentially as the intermittency.
Sam Berridge, a funds manager specialising in resources at Perennial, said BHP’s moves were consistent with many companies grappling with decarbonisation challenges. Mr Berridge noted miners in many ways had led the charge towards renewable energy because it often made sense for them to do so.
This was because mines tended to be “micro grids” in their own right and, historically, they had sourced much of their power from dirty and expensive diesel. “Now diesel has been sort of pushed off as being like the highest cost option, I suppose,” Mr Berridge said. “More solar has crept into the optimal energy mix up to circa 30 to 40 per cent depending on where that project is located. “And I think it’s starting to plateau at around about that level.”
However, Mr Berridge said the costs of running a mine on renewable energy started to rise “exponentially” beyond a certain point as the need to compensate for the intermittency of wind and solar power mounted.
The Pilbara in the NW of WA is one of the sunniest places in the world — 10 hours a day and 218 clear days a year. If we can’t make a solar powered microgrid work there, where can it work?
h/t David B, BallyB, Brenda Spence
10 out of 10 based on 109 ratings
8.9 out of 10 based on 15 ratings
 By Jo Nova By Jo Nova
This is where the worship of “expert” peer review science gets us — a science crime syndicate
Once science stopped being about winning arguments and became just the-number-of-papers-someone-published, it became an empty shell. And once billions of dollars, depended on sacred ‘experts’, it was doomed.
Long gone are the days when papers were hardly ever retracted and pal review was “the big problem? Now, fake papers and fake editors are so rife they are their own specialist industry. Networks of brokers connect paper-mills up with authors and publishers and place batches of papers in journals with ‘friendly editors’. When Richardson et al analyzed PLOS ONE, they found 33 editors who seemed to have an extraordinarily high rate of retractions. One in particular had approved 79 papers of which, 49 had already been retracted.
Given the vital importance of peer review and science to the UN, the Labor Party and the Greens, the question is will they immediately launch an inquiry and set up a Royal Commission… or do nothing at all, and mention it to no one. Shh!
If an entire modern economy depended on getting science right, there would be constant monitoring and reporting studies like this. Instead some scandalous and systemic failure of science is reported every few years and all the people who “follow the science” don’t give a toss.
And this is just the tip of the iceberg –the study acknowledged that many fake papers had not even been discovered yet. And this paper doesn’t even mention the replication crisis where only half of all papers can even be replicated. Or worse, that the papers that were harder to replicate were more likely to be cited.
Wait til they find out thousands of real papers are worthless because they rely on broken climate models that got the core assumptions wrong decades ago. And that’s not just the papers pretending to predict the climate, but tens of thousands of other papers calculating the floods that won’t happen, or the birds that won’t be extinct, or the cost of building seawalls we won’t need, and of building planes that won’t fly on recycled canola oil. A whole generation of scientists spinning their wheels…
 (A) Retractions are increasingly published in batches. The ∼2010 spike in the number of large-batch retractions is almost entirely attributable to a large swath of conference proceedings articles retracted by IEEE. For the first time since this spike, the majority of 2023 retractions were reported in batches larger than 10 articles. Sophisticated global networks are infiltrating journals to publish fake papers
The problems Richardson and his colleagues documented are growing fast. The team built a list of papers identified in 55 databases of likely paper mill products, looking at the number of suspicious papers published each year between 2016 and 2020.
Richardson and his colleagues found that the problem goes far beyond networks of unscrupulous editors and authors scratching each other’s backs. They identified what appear to be coordinated efforts to arrange the publication of batches of dubious papers in multiple journals.
The team looked at more than 2000 papers flagged on PubPeer for containing duplicated images and identified clusters of papers that all shared images. Those sets of papers were often published around the same time and in a limited selection of journals. Looking at patterns of duplicated images is an “absolutely innovative” method for investigating these networks, Abalkina says. “No one has done this before.”
The rate of fake papers appears to be doubling much faster than the rate of retractions is:
They found that the number of suspected paper mill products doubled every 1.5 years—10 times faster than the rate of growth of the literature as a whole, although still a small proportion of papers overall. The number of retractions and papers flagged on PubPeer had also risen fast, doubling every 3.3 and 3.6 years, respectively, but not keeping pace with the increase in suspected fraudulent papers.
“This means that the percentage of fraudulent science is growing,” Abalkina says. That poses particular risks to fields like medical science, where the fake papers sometimes make their way into systematic reviews and meta-analyses, potentially distorting our understanding of drugs and treatments, she says.
At this rate, soon fake science will eclipse the real stuff, and if we could rule out Woke Science as well, perhaps it already has?
 (B) Annual global scientific activity as measured by items labeled as “journal article” or “conference proceeding article” in OpenAlex (47), as retracted articles reported by Retraction Watch, as PubPeer-commented articles and as suspected paper mill products. We make use of the linear trends observable in the log–linear plot to extrapolate these observations for the period 2020–2030. We show the 95% CI using shaded bands. The number of suspected paper mill products shows the largest growth rate, with a doubling time of 1.5 y. This paper mentions the word “fraud” 59 times. Commenters should be aware (sorry) the word gets caught in the filter here for legal reasons. So please use it carefully.
REFERENCE
Richardson et al (2025) The entities enabling scientific fraud at scale are large, resilient, and growing rapidly, August 4, 2025, 122 (32) e2420092122, https://doi.org/10.1073/pnas.2420092122
10 out of 10 based on 80 ratings
7.8 out of 10 based on 14 ratings
7.9 out of 10 based on 22 ratings
|
JoNova A science presenter, writer, speaker & former TV host; author of The Skeptic's Handbook (over 200,000 copies distributed & available in 15 languages).

Jo appreciates your support to help her keep doing what she does. This blog is funded by donations. Thanks!


 Follow Jo's Tweets
 To report "lost" comments or defamatory and offensive remarks, email the moderators at: support.jonova AT proton.me
Statistics
The nerds have the numbers on precious metals investments on the ASX
|


Recent Comments