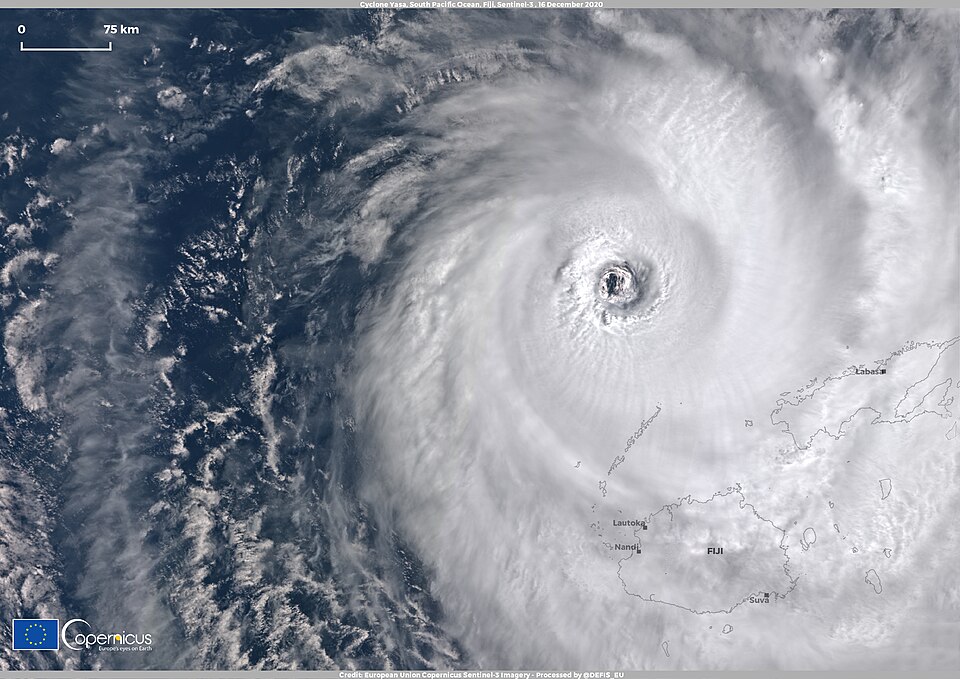
Cyclone Yasa, Fiji | Photo from Copernicus Sentinel-3 imagery
By Jo Nova
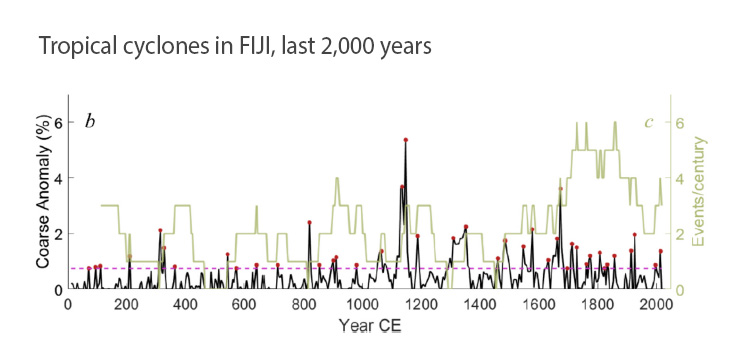
The worst 53 cyclones that hit Fiji in the last 2,000 years were more common in the coldest times, not the warmest ones.
We are told cyclones and extreme storms will be more intense in a warmer world, will have stronger wind speeds, may retain their strength longer and do more damage, our homes will be uninsurable, and this is the new normal. But the evidence continues to grow that warm times are wonderful, and the last thing we want is a colder climate.
There aren’t many long records of cyclones in the South Pacific, which hasn’t stopped climate experts blaming cars and burgers for horrible storms. But even though life on Earth depends upon understanding our climate, it’s only now, after 40 years of panic, that finally that researchers have studied things like pebble layers, shell fragments, and coral rubble in Fiji to find out what has happened there in the past. Yanan Li and others drilled cores to find debris pushed 120m into the mangroves by the worst of the worst tropical cyclones. Handily, they also had two bad storms recorded in the last century to calibrate what they found.
Awkwardly, the big storms were more common in the Little Ice Age. Basically, if we want fewer storms we should pay people to burn oil and gas, or at least give them a taxable discount for saving the world.*
All those layers of rocks and shells and whatnot have been sitting there in the mud flats the whole time that the UN has been trying to save the world from “climate change”:
These results also match what researchers in Australian found (Haig, Nott and Reichart). Likewise other researchers, looking at the Indian Ocean found cyclones have been decreasing as the world warmed in the last 70 years, which is also true in Australia since 1970.
Instead of cyclones being driven by one kindergarten variable like sea-surface temperatures (or more stupidly, global temperatures), it turns out that wind shear, humidity, local weather patterns, and things like La Nina conditions are probably a lot more important. If climate modelers had even the faintest clue of what drives the Pacific Decadal Oscillation, we could pretend to reduce storms by reducing La Nina conditions.
Until then, any journalist claiming that extreme storms are the new-normal should be roasted for promoting misinformation, or just being a gormless mouthpiece for bankers, bureaucrats and The Blob.
Intense tropical cyclone activity over the past 2000 years at Bay of Islands, Fiji
Yanan Li et al…
*Obviously, we wouldn’t pay people much to emit CO2 because it wouldn’t save us from the next Little Ice Age anyhow, but it will make plants grow, and that’s worth something.
REFERENCES
Yanan Li et al (2025) Intense tropical cyclone activity over the past 2000 years at Bay of Islands, Fiji, Palaeogeography, Palaeoclimatology, Palaeoecology, Volume 675, 1 October 2025, 113090, https://doi.org/10.1016/j.palaeo.2025.113090
Haig, J., Nott, J. and Reichart, G. (2014) Australian tropical cyclone activity lower than at any time over the past 550–1,500 years, Nature 505, 667–671 doi:10.1038/nature12882 [Abstract]
Roose, S., Ajayamohan, R.S., Ray, P. et al. Pacific decadal oscillation causes fewer near-equatorial cyclones in the North Indian Ocean. Nat Commun 14, 5099 (2023). https://doi.org/10.1038/s41467-023-40642-x


I can’t find the interview with Richard Lindzen, atmospheric physicist when he said simply that classic meteorology teaches severity and frequency of storms drops with increasing temperature. But then Climate Changeologists disagree. They would. In Climatology, not meteorology, everything gets far worse with increasing temperature and CO2. Boiling oceans even. Which is so outrageously mad.
Dr. Judith Curry became famous for a paper where she claimed data showed that frequency of hurricanes increased with increasing temperature. She became a darling of the Climatology crowd. Until she apologized that she had made a mistake and the reverse was true. She has since left the university and practices as a climate adviser for businesses where she says the major influences on climate are just two, solar cycles and ocean cycles.
And you have to suspect that what is said publicly is very different to what serious people believe. Especially consulting engineers and investors. Just look at the development around the world with massive long term investments offshore as in the cities and airports in the ocean. Dubai,Gibraltar, Nice, Hong Kong, Yokahama, many more. Even in the Maldives they have added another seven airports for the booming tourist trade while officially claiming life is terrible and the place is sinking. Tiny Tuvalu though has the record as the least visited country in the world. Which is possibly why the inhabitants want to leave, not rising sea levels or storm frequency.
291
All this natural warmth is good and beneficial in every possible way, crop and other plant productivity, fewer storms and a more pleasant living environment.
Remind me again why Australia is shutting down its electricity supply and destroying its economy?
And isn’t it interesting how humans love warmth? They vacation in warm places, not cold, unless for winter sports or if you happen to be a climate “scientist” who might go on an Australian taxpayer-funded adventure holiday to Antarctica.
310
A very simple answer to your question David. We are “governed” by communists who are determined to destroy us and sell us out to their masters, the UN
181
About 10yrs ago Ian Plimer showed (Geological evidence) that cold times meant more stormy weather. Enjoy the good times while we can.
251
Why doesn’t the Real World follow those Climate Models? LOL.
150
The models are correct. The real world is wrong. 🤣🤣🤣
200
The sky is falling. Foxy Loxy says so. And President Xi.
120
That’s exactly what Hansen said when none of his predictions came true. The science is not wrong. The Earth is just not behaving as it should.
200
How bent can you be.
130
Caution,
There are only 2.6 of these storm events per century, there are estimated temperature events of only a few degrees C allegedly involved in storm formation.
There is a definite probability that this is mere natural noise, with little hope that measurements of anything will help to understand causation. Geoff S
110
Yeah. Looks like just another fantasy instrument beloved by the paleo climate people: come up with some plausible story (only big storms reach the lagoon), some tenuous way this might be measured (an increased proportion of >63 μm particles in the sediment), some mystical incantations with the statistical software, and away you go.
Where does the time axis come from? Is there annular stratification in the sediment, or do they assume a constant rate of deposition? Who decided that 63 microns was the critical size? Are we *sure* that a properly big storm won’t stir up several previous centuries’ worth of sediments.
13
Whoops. That should have been annual, not annular.
20
I’ve added more information below the graph in the post. I did say they had two major storms in the last century to calibrate their study. So they have real met data from recent storms and find the effects of those storms in the sediment core.
They use accelerator mass spectrometry (AMS) radiocarbon dating of land based organic matter to date the sediment layers.
The similarities with the Nth Queensland study and with also Yongshu Reef in the South China sea suggest that this is a more widespread phenomenon. And I haven’t posted on this (yet) but there are studies from the Atlantic that show the same general trends. Storms were worse in the LIA. (Little Ice Age). So this study is but one of many, and there are many different ways to spot the effects of bad storms. Other studies look at marine isotopes, formanifera, pollen, marine species, salt intrusion, and some even use cave stagamites for flooding events.
The 63 micron cut off is a standard one used in many studies – it’s a boundary used to define the silt (eg in mangroves) as 3.9 – 63 micron. Sand is defined as 63 – 2000 microns. This is the Wentworth scale and is a USGS standard. (No relation).
80
Thank you Jo. I still side with Geoff Sherrington that there is probably more noise than signal in these measurements. The graph, IMO, is more or less the inverse of Von Neumann’s elephant: rather than too many parameters, there are too few; but there are many *factors* that have simply been ignored. Wished away.
Paleoclimatology is rife with it:
Tree rings: ring width is affected by temperature, ∴ it’s a thermometer (don’t mention rainfall).
Ice cores: Oxygen 18 content in precipitation is affected by temperature, ∴ it’s a thermometer (hush about the wind).
Sediments: Higher proportion of large particles will be caused by storms, ∴ it’s a storm counter (tsunamis? what tsunamis).
I looked at the link to the paper yesterday, but it only gave snippets. Fiji is in a seismically active area, and tsunamis can scour a coast as harshly as the biggest storms. Does the paper explain how they’ve excluded tsunamis from the storm tally?
And that’s just one possible confounder. Another: volcanic eruptions can put quite a few large particles in the air that will sediment out somewhere. Another: disturbance from creatures that burrow in the mangrove muds. Have they checked multiple cores for agreement?
10
Oh wow, thanks for that extra info on the graph, Jo!
I’m now ashamed of myself for not having asked years ago. I lacked the moral courage to speak up, and yet my asking was met so terrifically.
It’s been an occasional issue with some posts for many years, that I can’t go shove some clear evidence into the face of an alarmist, because I don’t understand how the (graphing of) the evidence demonstrates its conclusion.
10
The worst and most deadly cyclone to hit Australia was Cyclone Mahina in 1899. It is also probably the most intense cyclone ever in the southern hemisphere. Currently, based on new post storm analysis from scientists in Queensland, it looks like the actual central pressure was 880 hPa which would make this the most intense tropical cyclone to have made landfall anywhere in the world – EVA, EVA!!!!!. And all whilst global and sea surface temperatures were squillions of degrees cooler than today
140
The truly sad and depressing thing about this, is that idiots like Bown, clowns like Cannon Broooks, and all the other gormless and gullible fools and renewable snakeoil salesman do not read these papers, or visit sites like Jo’s, or accept anything that contradicts their core beliefs. Fools dangerous and damaging fools.
221
If you believe they believe it. Like the Wuhan Flu, Climate Change seems to be the way of seizing power, controlling you, limiting where you live, what you do and even what you eat. In that sense it is working very well. It’s the transition to communism, absolute dictatorship, all for your own good. I just don’t believe anyone is so stupid.
Our communist rulers know exactly what they are doing in shutting down reliable diversified energy systems and converting them all to a single point in Canberra under their control. Who needed a National Grid? No one. But when coal produces the power, by law it is controlled by the states who own the mineral resources. So coal has to go. In Victoria we are not even allowed export it.
231
I linked to Dr Nott’s studies about Australian super cyclones finishing in about 1820 and their ABC Catalyst story sparked my interest at that time.
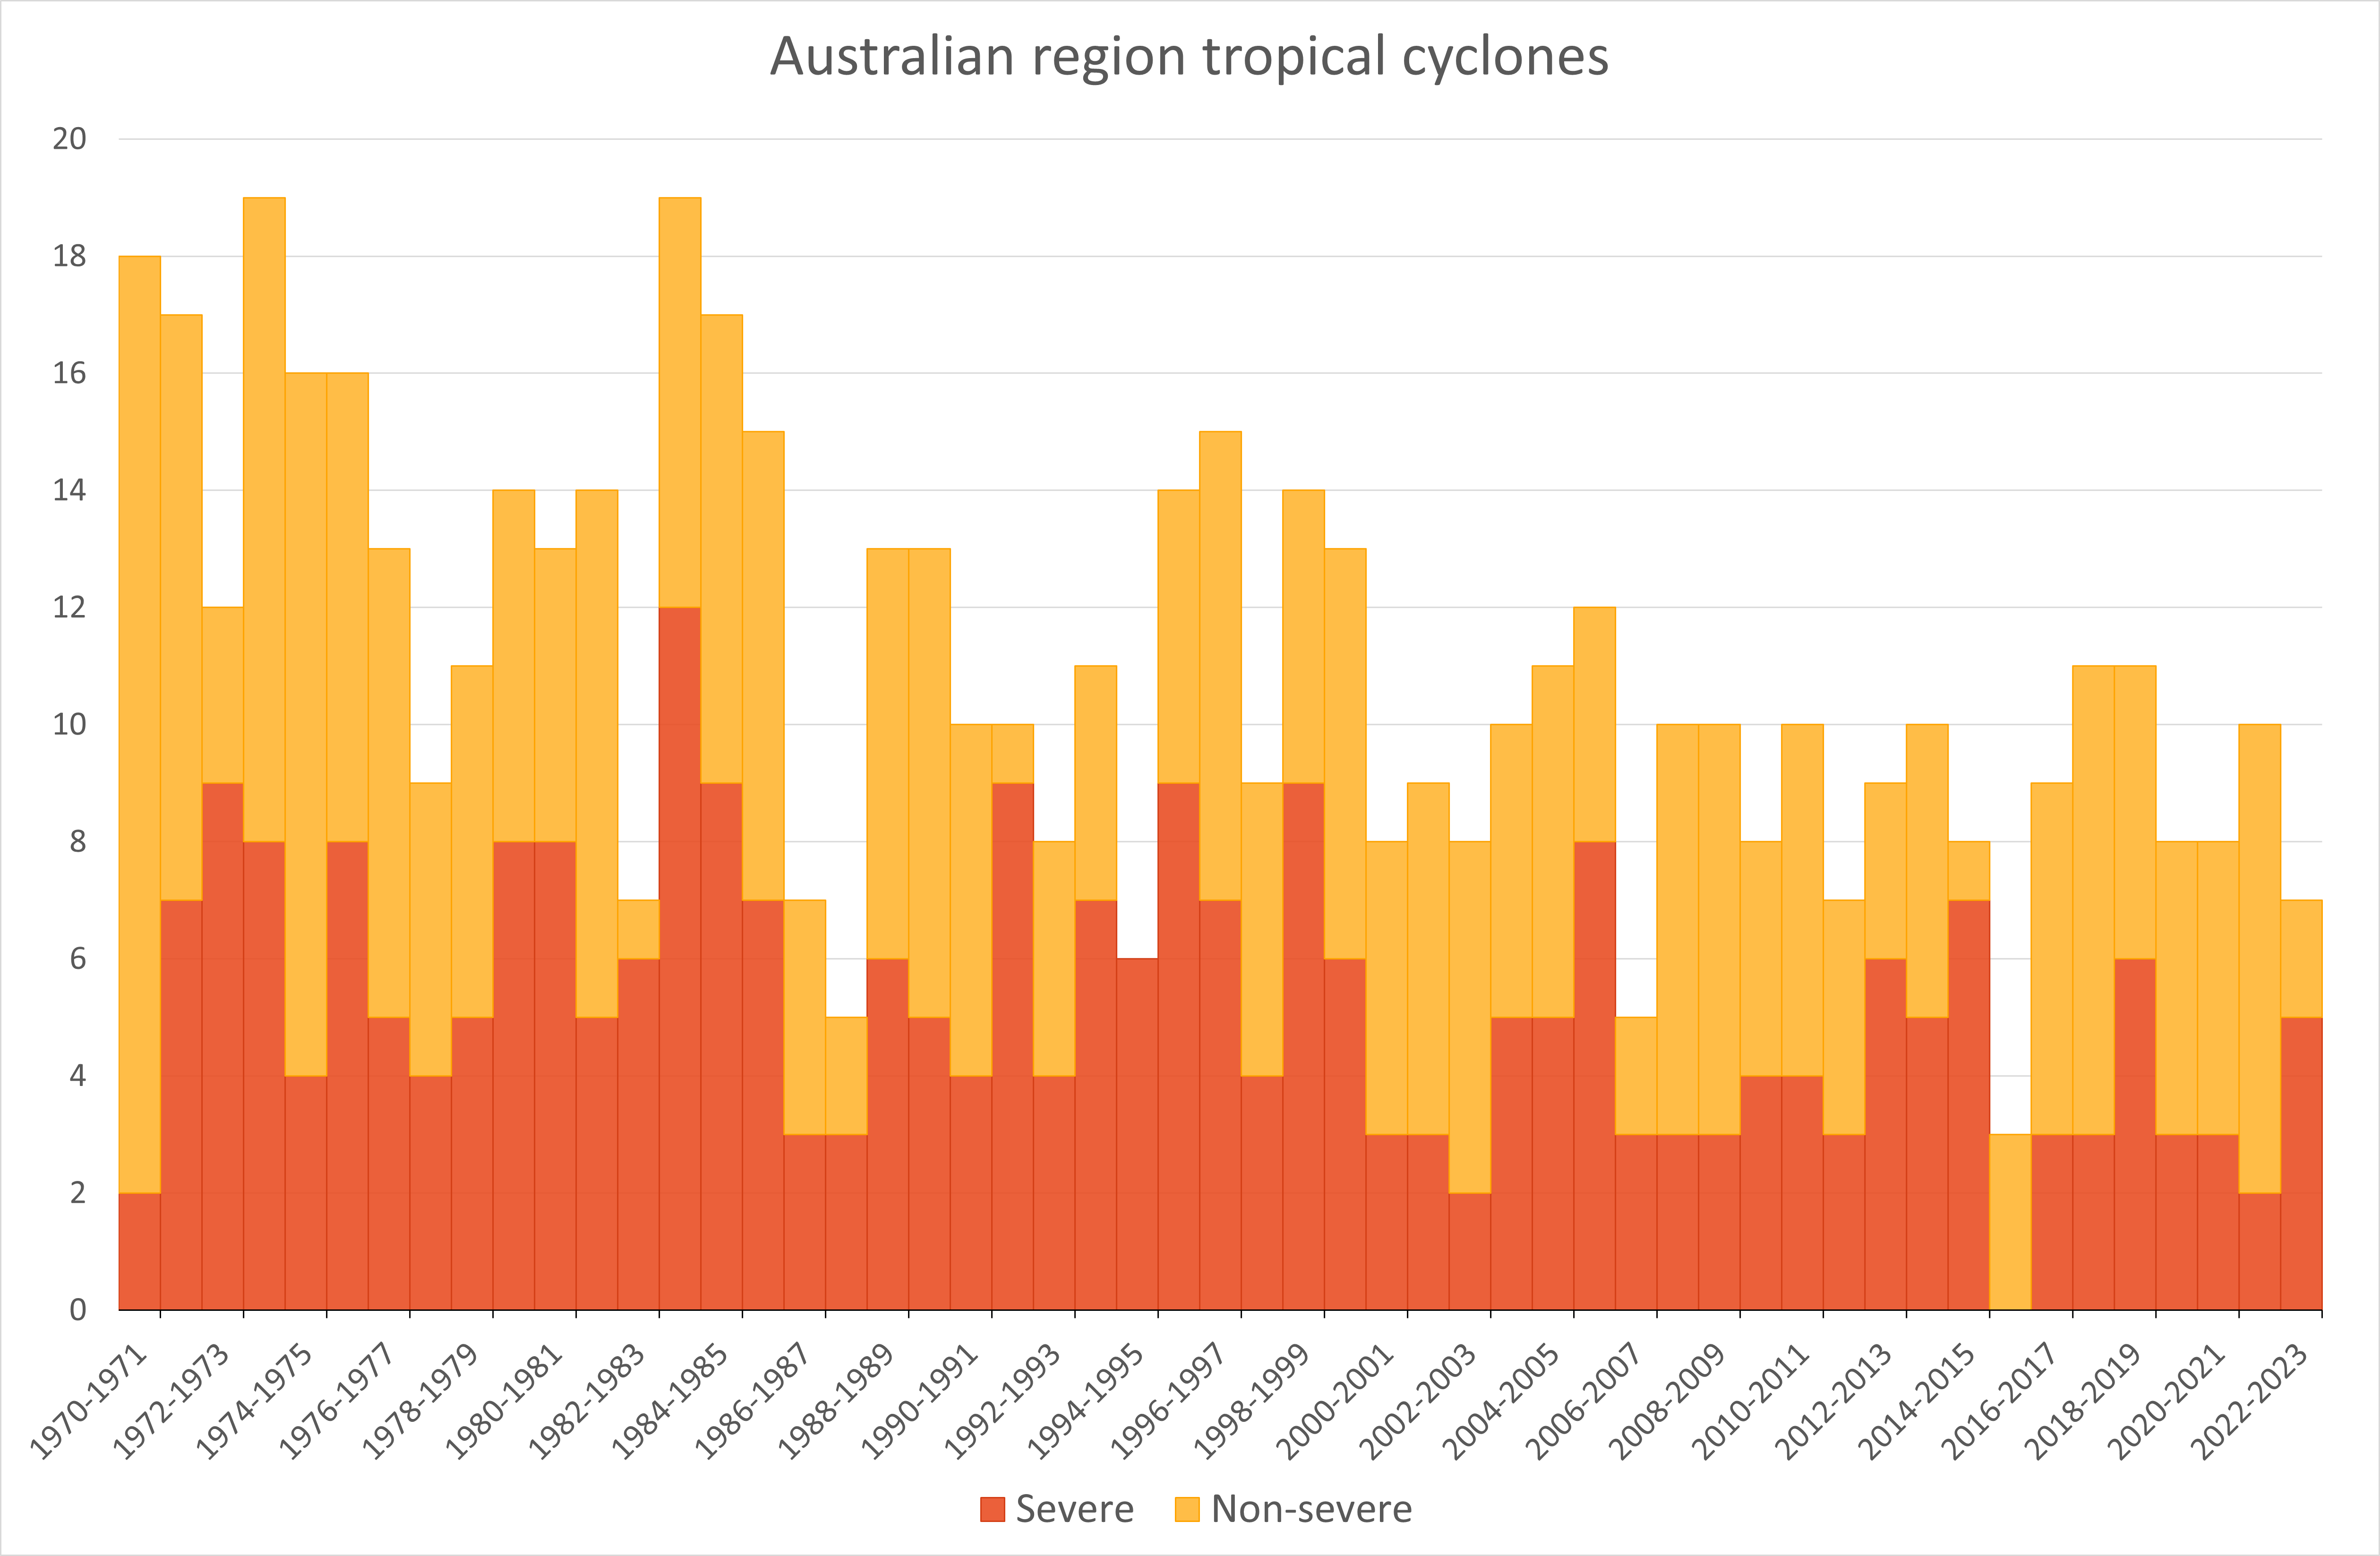
Jo has included the BOM Aussie region cyclone graph from 1970 to 2024 and you’ll note that the 2016 to 17 season is the only time we’ve had zero severe cyclones.
Albo and B O Bowen etc have yapped about stronger cyclones many times yet the genuine scientists know they are wrong.
So why are we wasting TRILLIONs of $ on toxic, unreliable W & S and destroying our environments for a ZERO return?
210
The summer of 2016/17 is the spanner in the works: an El Niño heatspike – accompanied by claims of hottest ever at the time – and yet not one major troppo and only 3 wannabes: howzat for climate ‘action’, an immediate cessation of storminess due to a warmer oceanic planet.
I like warmth, vote for warmth, more warmth please.
110
“So why are we wasting TRILLIONS of $ on toxic, unreliable W & S and destroying our environments for a ZERO return?”
Simple:
It is THE SCIENCE” ™
POLITICAL “SCIENCE”.
The usual suspects at play, with the lives of billions of real people.
30
This was always one of the claims of the climate alarmists that was always nonsense. Up there with the extinction of the polar bears. But the claim that cyclones will be more frequent and more intense due to climate change still gets trottted out whenever there’s a storm or cyclone or even some above average wind. It can be all traced back to the IPCC. Roger Pielke Jnr Pielke has always said that there was no discernable connection between human CO2 emissions and extreme weather events. That, there is no convincing evidence they are becoming more frequent or more severe. None. But his evidence was ignored. In Donna Laframboise’s 2011 book, “The Delinquent Teenager” which was about the IPCC during the 1990’s/ 2000’s, she wrote “Invented opinion. Faked evidence. The chapter in which the IPCC discussed natural disasters was not a gold standard effort. Sub-standard is more like it. This surely calls into question the numerous other sections of the Climate Bible in which Rosenzweig and Karoly were involved” Karoly being our own David Karoly ( Australia ), now ex CSIRO, who bobs up every now and then to talk on this subject. The paper referred to in this article just re- enforces what we already know- that man made global warming/ climate change is just a scam.
181
We had that real climate alarm a couple of years ago during the US hurricane season. I remember reading a blog where some delusional young woman was screaming climate changed caused so many hurricanes in the Gulf of Mexico – sorry, Gulf of America – that they had run out of names. We are all going to die.
What nobody had pointed out to her was that the WMO had just changed their naming protocols and the anything from a hurricane to each individual seagull fart suddenly had a name. This was in an attempt to make things look worse than they really were because good old Mother Nature was not playing ball and hurricanes were not increasing in intensity or frequency. Blatant dishonesty.
161
Where’s Simon et al, they’ll put us right, obviously we’ve misunderstood something.
100
Yep. Cyclones, like other windy things, are about temperature difference, in this case between warm oceans and cooler air. The difference is greater when air is cooler as ocean temps don’t change as much. nice to see this very old observation supported by basic physics being borne out in the historical observations.
71
Yep. Complete bollocks. According to NASA “Ninety percent of global warming is occurring in the ocean, causing the water’s internal heat to increase” So ocean temps don’t change much is directly in conflict with NASA observations. Ya can’t have your cake and eat it, or are you dismissing NASA as talking crap?
50
The Atlantic hurricane season.
‘The US Eastern Seaboard also experienced heightened hurricane activity during the LIA, whereas the Gulf of Mexico and Southern Caribbean were inactive.
‘This suggests that despite a globally cooler climate, regional climate conditions during the LIA remained favorable for cyclogenesis and intensification along certain Atlantic hurricane pathways.
‘Perhaps heightened Sahel rainfall during the LIA indicates an increase in African Easterly waves, which in turn possibly seeded more tropical cyclones in the Atlantic Main Development Region.’ (Winkler et al 2023)
41
My wife an I got married on 16th March 1985. We went to the airport to catch a flight to Fiji. Unfortunately a cyclone (Hina) had pretty much wiped out everything. We went the next day but had to endure generators and rearrange our island portion of the honeymoon.
60
We all know that climate change is a Chinese(long term) plot, Albo & Bowen are just puppets. Tinman and lion on the yellow brick road to Bejing. Crettins.
140
I’m sorry to contradict a fellow sceptic, but in fact we don’t all know that.
I am happy to acknowledge the CCP are abusing the issue, with everything from spyware and kill switches in solar converters, to hypocritical double standards that tremendously damage the economies of western countries in comparison to their own. And other instances that Jo has documented. But that doesn’t make climate change a Chinese plot.
I’m happy to acknowledge that Albo and Bowen are useful idiots, damaging the economy for the sake of virtue-signalling toward Climate alarm. I admit that much of what they choose to do is the same as what they would be forced to do if they were puppets of the CCP. But that just makes them idiots, not puppets.
We must beware the temptation to overstate our case beyond what the evidence supports. Otherwise we’ll end up as crazy as the Loonie Left, and with no more credibility than the Democrats.
70
The Co2 Coalition Scientists have told us that a warmer world is a safer world.
In the early 20th century many more people died from extreme weather events, yet the population today has over 6 billion more people at risk.
Alex Epstein was correct when he claimed that using fossil fuels changed a dangerous world into a much safer place for Humans to live.
Dr Christy also added that before fossil fuels our lives were brutal and short.
Of course during the first 99.9% of the last 300,000 years Human life expectancy was under 30 years and today is about 73 years and much higher in OECD countries.
And today deaths from extreme weather events have dropped by 98% and yet very few people understand or are aware of the data.
120
‘Multiple centennial-scale quiescent periods (from 200 to 300 CE and 1000 to 1150 CE) and active periods (namely from 350 to 750 CE, 900 to 1000 CE, 1150 to 1250 CE, 1400 to 1500 CE, and 1650 to 2017 CE) are found in the reconstruction, and the most active interval spans from 1650 to 1800 CE at 4.5 events/century.’
The Medieval Warm Period seems out of sync.
21
Of course if I had first read the post.
‘Decline of TC occurrence in the western SP during the Medieval Climate Anomaly is attributed to the northward movement of SPCZ.’
31
There will not be a climate crisis.
However, there is a developing, probably unavoidable, political crisis which is rooted in the phobic imagining of a climate crisis.
Climate concerns will fade as they are overtaken by the dissolution which they begat.
150
On France 2 news (SBS World Watch) currently, almost the whole broadcast is devoted to the canicule, the French version of heatwaves.
The apparent hype is surely indicative of the global warming push. Viewers are treated to regular scenes of hospitalized victims of the dreaded heat, people cooling off in anything with water and of course, those dark red heat maps, propped up with interviews with experts of the science predicting worse to come as a result of the consequences of the human causation of global warming. Sapristi! Don’t these France 2 news climate thespians appreciate the fact that I am trying to improve my French langusge skills? Domage, I am becoming suspicious that they want me to worry that France will boil before I get there.
111
“probably unavoidable, political crisis which is rooted in the phobic imagining”
Well said Honk. 👍
70
Here’s the Worldometers data for global life expectancy and now about 73.5 years and they use the UN data etc.
We’ve come a long way since 1950 and many graphs and active graphs to look at. Human population in 1950 just 2.5 billion and over 8.1 billion today.
So why can’t the Albo and B O Bowen loonies spend a few minutes online and save Aussies up to 9 TRILLION $ and guaranteed bankruptcy for many generations?
https://www.worldometers.info/demographics/world-demographics/
70
Interesting that Dr Rosling’s Human life expectancy quote for 1800 was “under 40”, but today all references are under 30 years and just 32 years in 1900.
Here’s his health & wealth joy of stats BBC video in under 5 minutes in 2010.
https://www.youtube.com/watch?v=jbkSRLYSojo
60
In India, 24 years. Which is why India and China are now 1.4Billion, not population explosion. Longevity.
60
Cyclones form over warm seas whose temperature exceeds 26C and draw air from colder surrounding regions. In simple terms the intensity of a cyclone is determined by the pressure difference in the area of its origin and the surrounding colder area.
The pressure difference driving the sir flow into the eye of the cyclones is determined by the difference in density of the air at ground level over the colder surrounding and the warmer core of the cyclone.
By the universal gas law, air density is proportional to the reciprocal of the temperature. In an averagely warming climate two conditions can apply – the warming can be due to increase in the colder area alone or both the warm and the cold areas can warm equally. In either circumstance the pressure and density difference will reduce with an increase in temperature. So in both cases the intensity of the cyclone will reduce with warmer average temperature.
It is also the case for storms in general and in colder climates winter storms are much more intense than during the summer.
100
A combination of Charles’ Law and the Archimedes principle providing massive lift. The amount of lift is related to the difference in volume displaced which goes as 1/T.
So 1/T1-1/T2 = (T2-T1)/(T1T2). So the difference in temperature drives the lift but reduced by the square of the temperature.
Unlike water which doesn’t expand much and in which the temperature differences are rarely as great, hot air can have the same lift as hydrogen, which is why hot air balloons work so well. And as hot air rockets up any sideways movement produces spinning which creates a vortex.
Another ramification of this is that CO2 is incredibly well mixed and quickly. But currents in the ocean can contain heat and gases including CO2 and travel great distances unmixed as with the Gulf Stream. So you can get phenomena like El Nino and La Nina and Global Warming associated with changes in CO2 in the air. Quite apart from Henry’s Law which is annual cycling you see in the tropical CO2 record. But it’s easier to blame car exhausts even when fossil fuel only adds 0.02% to total CO2 each year, not 0.4% which is the slow linear shift in the CO2 equilibrium point. This is most likely an ocean cycle.
And we do not see such rapid CO2 cycles in the ice core record beyond 250 years as they lose CO2 and time resolution in the formation of metamorphic ice.
80
Beautifully explained there tmatsci. So much so that I will copy and paste that to my archived comments. 🙂
60
Jo, can I please ask you to explain the significance of the axes of graphs you post with those graphs?
What is the Coarse Anomaly percent? Percent of what, and anomalous to what? What are the b and c in there?
Really only 6 events per century? I may be misunderstanding what events he’s talking about, but if that’s hurricanes, I am highly sceptical of the claim. If they’re claiming ‘increased temperature means increased events (hurricanes?)’ the data doesn’t seem to support or deny the claim.
If that’s NOT hurricanes per century, then what is it?
I can’t go forward armed with these graphs to persuade the unsceptical if I don’t understand them myself. Which I don’t; not even when armed with Google and ChatGPT. I make no claim to expertise in this field, yet I do have a better grasp than the average reader. Especially those believers given their opinions from the Guardian. You do arm me to show the alarmed what’s really happening, but I need even more, please and thank you.
50
The course anomaly (%) means the percentage of coarse particles in that layer that are > 63 micrometer. The sediment core they dug is in protected mudflats in mangroves that are 120m above the current high tide line. Storms surges rarely go that far.
It is “events” or major cyclones/hurricanes per century. Obviously only the biggest storms (and presumably near direct hits) would leave sediments there. Some of the particles they found were > 1cm.
They estimated that the storms would be at least a Cat 4-5 strength.
I would guess Fiji gets many more minor storms, or goes through the edge of big storms that don’t drag detritus that far up the mangroves. So 6 events a century means 6 x cat 4-5s. It’s possible their system would miss a few big storms if they hit at low tide, but at least it is measuring consistent conditions from century to century.
Fiji gets a few named cyclones every year. But these won’t have the energy to overtop the reef, break through mangroves, and carry sand and shells 120m inland.
I will add some of this to the info on the graph in the post.
[And for no good reason my own answer was hidden in moderation for 2 hours? – Jo]
90
Thank you so much, Jo!
Oh- and lol for the irony.
30
The course anomaly (%) means the percentage of coarse particles in that layer that are > 63 micrometer. The sediment core they dug is in protected mudflats in mangroves that are 120m above the current high tide line. Storms surges rarely go that far. “Events” means only major Cat 4-5 strength cyclones/hurricanes per century. Obviously only the biggest storms (and presumably near direct hits) would leave sediments there. Some of the particles they found were > 1cm. Fiji gets a few named cyclones every year. But these won’t have the energy to overtop the reef, break through mangroves, and carry sand and shells 120m inland.
I think it is about the sediment, which they infer as an indication of the level/severity of storms. A geological storm measure, if you will.
40
Check “Extreme Floods” by Robert Doe who was searching for a climate signature in recent flooding – eg The flooding in the UK in 2004. He has a good section on ancient floods including the Annus Horribilis of 1236 that drowned 100s of people during a massive storm surge and the continuation of flooding into 1237/38 and on into the latter parts of the 13th century and into the 15th Century – during the little Ice Age. These were extreme events in cold periods.
30