Questions about the BOM spread: “Adjusted Temperatures Need Explaining” by Tony Cox in the Newcastle Herald. Jennifer Marohasy picks it up and draws attention to the situation of Newcastle temperatures, which were recorded at Nobbys Signal Station, near the Lighthouse at Nobby’s Head.
Old Trove archive records show that in the 1939 heatwave there were protests that Nobby’s Head temperatures were too cool to represent the real heat going on in Newcastle because it is exposed to good sea-breezes. (h/t to Siliggy)
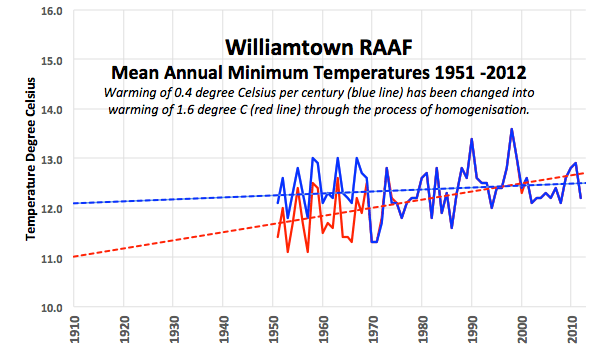
The BOM page for Nobby’s links to this graph of the raw data.

The raw data from Nobby’s shows a hot period in the late 1880s. This is Climate Data Online or CDO.
Jen Marohasy points out that the BOM ignore this long record and use Williamston RAAF near Newcastle instead as one of the 112 stations to calculate national trends.
Note the trends…. adjusted of course.
…
Marohasy argues that the BOM ignore the better long record and use the shorter airport instead:
“…it’s not the best temperature series for the Newcastle region. It only starts in about 1951. A much more comprehensive record, but one that is conveniently ignored by the Bureau in the development of the official temperature network, comes from the Nobby’s Signal Station, Newcastle. This record starts way back in 1862, and guess what, like most of the really long records it shows that it was much warmer in the late 1800s than for any time since. In fact the hottest years on record are 1877 and 1878.”
So is there a good reason to ignore Nobbys? I would like to know.
I went hunting for reasons, but came up empty. The basic site summary for Nobby’s tells us thermometers were installed in 1862 and removed in 2001. The Equipment history is on page 14. Most thermometer changes are in the last 14 years. There are no site changes recorded from 1862 – 1998 — though the report warns that historical data may not be switched over from paper records to PDF. It’s probably incomplete.
The Metadata for the Newcastle temperature record up until 1993 was summarised by Torok (1996) from the official station correspondence as follows:
Record of Changes in temperature measurement at Newcastle (BOM No. 061055)
1922 Dec: First official correspondence.
1943 Dec: Building to occur.
1955 Dec: Screen moved 40 feet west due to construction of tower.
1965 Aug: Screen stand is 6 inches too low and painted black.
1975 Oct: Building has rendered site poor.
1989 Feb: Screen recently moved out of enclosed position.
Source: (Torok, 1996, Vol 2 p. 255). Warwick Hughes site has links to the Torok PhD thesis, Appendix A.
The BEST project looked at Nobby’s and published their version here. They list the reasons for continuity breaks.
“A further column dates at which the raw data may be subject to continuity “breaks” due to documented station moves (denoted “1”), prolonged measurement % gaps (denoted “2”), documented time of observation changes (denoted “3”) and other empirically determined inhomogeneities (denoted “4”).”
When I look at their breaks I see a “2” then several “4s”. Did I miss any? That would mean that apart from a gap in measurements, all the BEST adjustments are thanks to “empirically determined inhomogeneities” Does this mean statistical tests? How does any statistical test on noisy data figure out what is a unrecorded station move and what is a step change in climatic patterns? The BEST adjustments are not due to site changes that they have documentation for. What does empirical data mean anymore if it is adjusted post hoc for no physical known reason?


“People underestimate the power of models. Observational evidence is not very useful.”
http://wattsupwiththat.com/2011/05/16/people-underestimate-the-power-of-models-observational-evidence-is-not-very-useful/
At least you can’t accuse them of not living by the garbage that they preach 🙂
494
Eric, Anthony Watts has been noticing similar “oddities” in adjustments on his side of the world as well.
“It has been said before. It will be said again. The adjustments always seem to add to global warming.”
http://wattsupwiththat.com/2014/09/15/nasa-giss-tweaks-the-short-term-global-temperature-trend-upwards/
341
When you make a model you can add your own details….The result is that you can never be wrong regardless of observable results,and to make things even better you get some friends/colleagues/sycophants/those terrified of losing their careers to agree with your model/s and voila you have a “peer review”.
40
I’ve wondered about those high temps at Nobbys 1877-8. The local rainfall was a bit below average for those years, but no biggie. (I’m not surprised that Nobbys didn’t reflect the heat in the city in 1939. After all, as mentioned on a previous thread, Wedding Cake West on Sydney Harbour was freakishly cooler when Sydney set its new max record in Jan 2013 – just a paddle away!)
Here’s a thought: what about wind direction? If westerlies were frequent enough in a hot year there would be little relief close to the water eg 1791, early 1980s. Of course, it would have to be a very long domination of westerlies to affect annual temps at Nobbys that way, something extraordinary. But it’s worth remembering that this was a remarkable period for climate everywhere, cold and stupendously wet in the British Isles according to CET, and this coincided with South America’s worst known drought, the Great Drought which killed 5% of Brazil’s population and 14% in the northeast of Brazil. (Yeah, I know that Brazil’s recent drought is supposed to be “unprecedented” but…) Add to that the Great Famine of 1876–78 in India and it’s fair to guess that monsoon failures and other very naughty climate factors were at work in a very big way.
That’s why eyewitness accounts and “anecdotes” matter. Numbers can tell you a bit, but if you want to know what was behind events like Chicago/Peshtigo or Victoria 1851 you need to know what wind was doing and for how long, among many other things numbers won’t tell you.
Of course, to discuss any of this you need people who are actually interested in climate change…as opposed to most “climate change experts”, who wouldn’t know a change of climate if it jumped in their laps and did a performance of Aida with live elephants.
401
While 1877 is the reached the highest temperatures in the maximums, it is also the year it reached the lowest in the minimums. Looks like the weather was far more extreme back then.
http://www.bom.gov.au/jsp/ncc/cdio/weatherData/av?p_nccObsCode=38&p_display_type=dataFile&p_startYear=&p_c=&p_stn_num=061055
The wind must have been blowing the warm way on Jan 14 1939. This is when the hottest daily temperature of 44.4 degrees C seems to have been recorded (if this is an evening paper).
http://trove.nla.gov.au/ndp/del/article/126375944
Oh and those elephants may not have sucked the minimums up recently, that tall step may have have been partly due to the 1989 screen move.
111
‘Looks like the weather was far more extreme back then.’
The heat was of a universal nature, the blip is clearly visible here.
http://www.metoffice.gov.uk/hadobs/crutem3/diagnostics/global/nh+sh/annual_bar.png
Not sure of the cause, except that it wasn’t a harmless trace, but might have something to do with the shiny orb.
10
Personal anecdote about westerly wind at Merewether, which is a couple of kms south of Nobbys, Robert, and might explain why Nobbys is an interesting temperature record.
A blasting westerly of about 40knots down the Hunter Valley hit the beach near our house on a February afternoon in the 1990s. I had the children at the beach after school, and we all recall being in the water with a scorching westerly at our backs and a cool nor’easter from the water, all in the space of a couple of metres.
Nobbys is interesting for temperatures, but so is the Newcastle Pilot Station for sea levels and sea temperatures. (ATT Jennifer)
100
Looks like the can of worms is opening. I like the slow drip drip maximum damage to BOM’s credibility. Next up is probably a hunt for whoever’s currently trying to cover it all up.
Time for a BOM whistle blower to appear.
http://thepointman.wordpress.com/2012/10/05/im-looking-for-a-snitch-who-wants-to-get-rich/
Pointman
411
The most damaging revolution is the BOM never checked their own data – they just lazily applied a homogenisation algorithm to the whole set, and spat out a meaningless number.
Granted there are a lot of stations, but with their budget, they could have done a lot better.
474
A lot of stations is no excuse.
I recall the investigation into the Challenger disaster was extremely thorough. And the program code was carefully checked line by line.
Laziness is would be the good answer, purposeful would be an uncomfortable answer.
90
At least contrary to what is being said about the hottest, driest, coldest year ever (due to global warming) we now know from the old records at Bourke, and now Newcastle, that it was much hotter in the 1880’s. Wasn’t much industry then, nor power stations to blame it on.
311
Actually, wasn’t Newcastle a major port area just near Nobby’s.. way back.
Didn’t the coal lines run right up the Foreshore?
Newcastle guys.. History please. 🙂
40
Nobbys was once a coal mine itself. Back then it was an island called “coal island”. It was an island when Captain cook found it in 1770! So did the seas fall or was the junction to land man made?
http://trove.nla.gov.au/ndp/del/article/18512875?zoomLevel=6
50
From the font of dubious knowledge (Wiki)
“Governor Macquarie ordered a pier to be built to join Coal island to Collier Point. The pier was started on 5 August 1818 and convict labour was used to do the construction. It took 38 years to complete the pier and during this time numerous convicts were lost to the sea due to the convicts having to work through all sea and weather conditions, night and day”
90
better.
40
Better again.
http://trove.nla.gov.au/ndp/del/article/136885023?
40
Nobbys is a lighthouse which sits on the mid-point of an artificially created harbour wall. The piece of rock which is now Nobbys was connected in 1846 in what was then one of the major construction projects in the colony. Subsequently the break wall connecting Nobbys with the mainland was further extended by an equivalent amount, about 600 meters, to complete the harbour entrance.
In effect Nobbys sits on a tiny island off the coast of Newcastle which has been connected to the mainland.
As such Nobbys is not subject to any UHIE and its temperature record beginning in 1862 would constitute one of the purest temperature records not only in Australia but the world.
Of course it is not included in ACORN.
372
I should also point out that Nobbys sits on the entrance to the mighty Hunter river.
92
Adelaide has one of the longest temp records too remember although unfortunately they moved it from West Parklands to BOM headquarters in Kent Town in 1979.
160
The very Best! At West Terrace Adelaide for a very long time there were three different types of stand running side by side and the measurements taken by a world leading dedicated fanatic.
Adelaide had a Glaisher stand from day one around 1856. Then beside that a Sir Charles Todd manufactured thermometer house, then at 1887 beside those both a Stevenson Screen, then decades later another Stevenson screen all runing side by side with temperatures taken on the lot overlaping for many decades. These also ompared to private readings around town and at the nearby observatory. Yet with all this the BoM only include the post 1887 data on the CDO (raw) online record. Completely out of line with what they have done in other capital cities. Incompetance or censorship?
150
I’m guessing that the BOM moved to Kent Town in 1977 (and kept West Terrace going until 1979) because they needed larger premises which could not be built at the original site because of restrictions on building on Adelaide’s green belt of parklands designed by Colonel Light in the 1830s.
The current site isn’t great but was probably the best available at the time.
30
Anyone from Newy know where the weather station at Williamstown is?
I can’t see it on Google Earth.
40
At the RAAF base.
30
ps, It’s Williamtown, not Williamstown (that’s in Victoria).
60
me bad. !! 🙁
Will try not to do it again 🙂
50
Location of Williamtown AWS;
http://i255.photobucket.com/albums/hh154/crocko05/WilliamtownAWS_zpse4cebf53.jpg
Location of Williamtown AWS compared to Nobbys AWS (16km’s NNE);
http://i255.photobucket.com/albums/hh154/crocko05/Nobbys-Williamtown_zps7cea4a88.jpg
On average, daytime temps at Williamtown can be 2-4C above Nobbys. This becomes greater during summer when Nobbys gets the ‘nor-easters’ (the sea breeze). Night time temps are generally 2-4C lower than Nobbys.
10
try this:
32.7932°S 151.8359°E
30
Williamstown looks ok.. no tar/concrete within 50m. narrow runway about 100m away. No trees anywhere near.
Buildings about 150m to the ENE.. (which would be the direction of any coast breeze), but I doubt it would have all that much effect.
Looks like its been there for quite a while.
Why the heck would there be any need to adjust it !
283
We’ve had our orders.
170
It’s Williamtown. (no ‘s’) or as we refereed to it, Billsville.
Funny how the mind works really.
I was stationed there twice, the first time just for 7 Months in 1971 with 5OTU, operating Sabres, and Macchis. Then came the long stint from March of 1972 until July of 1980, with 76 Squadron, and when Gough disbanded them, off to 77 Squadron, both operating Mirages.
See the coordinates janama gave there, well that’s it. On the wider screen (Google Earth) you see a set of buildings to the right. That was where the control tower was or maybe still is. Just forward of that is two small pads where the Search and Rescue parked their two Iroquois, because their ‘rooms’ were in that same complex of buildings
Off to the left of the coordinates is the FRA. 76, 77 and 2OCU would operate part of the Squadron from there during either Air to Air, or Air to Ground or if there was an Adex, once or twice a year. See how there’s 8 slots on that concrete hard stand, now with concrete walls separating each slot. That thinnish blacktop is the Taxiway, and the main strip is a little further out.
The square ‘C’ shaped building just above the FRA is the Flight Line Hut at the top of the ‘C’ and the Gunnies (Armorers) section at the bottom of the ‘C’.
Other than inside that small flight line hut (as it was called) it was always pretty open.
As soon a I took the coordinates, it all came back, and the mind just painted the picture as I remember it, because, being there for so long, I was at the FRA so many times. usually three or four times a year, sometimes more.
I often recall being out at the furthest point, at the end of the black hose, pumping 800 gallons of Avtur into those Miracles, and as that end slot was closest to the coordinates, looking out to see someone at that screen taking their notes. A guy would walk out from the tower complex and do his checks.
It may seem I’m offering up Military knowledge here, but hey, all this was 40 years ago now, and those Mirages are long long gone.
Tony.
151
Very different now, Tony.
Still a top RAAF base, always will be, but also the best and cheapest way to avoid Sydney. Thirty mins from Newie, $95 return Brisbane or Melbourne, and off you go to wherever, compared to the F3 and the slog down to Sydney airport and all of the arduous stuff that goes with it. And the extreme prices.
What was that old saying? “One hour away, and a thousand miles from care” or something like that, but Williamtown to Brisbane or Melbourne is perfect for travelling from the Hunter to anywhere except Sydney.
50
Hi Tony,
I recently finished a 3 year contract at Williamtown base ( I had to evacuate my lodgings at Medowie in the recent bushfires). Lunch at Fighterworld watching the FA-18’s, Wedgetails, and occasional C17, Herc, and Orions was great.
You may well be surprised to know the very same Barber is still conducting his craft at the base.
20
I met the barber when I flew electric powered r/c gliders at the field at Ash Island a few years ago.
KK
10
I kept ringing that number but got no reply,bummer.
00
Oops,this was supposed to be a silly little reply to janama(oh well at least I thought it was funny)
00
Because it didn’t show a warming trend, Griss, geez, will you come to the meetings…
203
A quick regression of the annual averages, 1862 thu 2013 yielded an equation of t = – 0.0058X + 33.017, with an R2 = 0.07761. Thus on the face of it the temperature at Nobbys is actually declining very slightly at a rate of 0.058 degs per century. The regression stat indicates that this is not a strong trend, and this is confirmed by the others stats on the data. Ie over the last 151 years the temperatures at Nobbys are going nowhere and are remarkably stable.
[edited as per author request]
70
There are lots of intriguing temperature charts like Nobby’s… many with Tmax very hot during that period 1880 to 1910, at least through Queensland and NSW. Thanks Jo for posting this example.
What I want to know though, is more information about placement of thermometers, year Stevenson screens were installed, and more. A lot of relevant information can probably be found in boxes with station records in the National Archives but its an ordeal even finding which repository is holding which station data.
I found a lot of useful information in the boxes for Bourke, including, for example, sketches showing exactly how thermometers were hung when a new telegraphic office was build in 1879. Even detail of the structure of the building including that it had a shingle roof.
But it took me months to get access to that box and then a trip to Chester Hill (western Sydney) to explore. That was for the early Bourke records. The later records are actually held in North Melbourne… held at a different place. Then there are missing records and that is another story.
I also have a pile of technical papers, many written in the late 1800s and early 1900s, which detail the few fractions of a degree up or down by which temp series could be adjusted depending on the structure in which thermometers were placed during this early period.
We really need to develop some expertise on this topic. I would be interested in hearing from anyone who would like to start reading the papers and/or helping locate which archive might hold the old records for Nobby’s etcetera.
My scanning of the literature, however, suggests that even accounting for placement of thermometers in non-Stevenscreen type structures… it will have little affect on the overall trend. That period 1877 to 1910 was hot which ever way you look at the data. Perhaps that’s why the BOM feel the need to delete it from the official record and/or avoid stations with long temp series?
223
Jennifer,
My husband Mike was on the board of the Newcastle Maritime Museum Society from the mid-90s to mid-00s, and is a current member. The museum holds extensive records, including from Nobbys and Fort Scratchley and (I believe) from the old Maritime Services Board and the NSW State Dockyard, Newcastle being a maritime port from the early days of settlement. Many members are former senior port and maritime personnel.
Peter Morris (former MHR) is the head, but I think Deb Mastello is the first person to speak to at the Maritime Centre about access to records, but there is no shortage of people who live and breathe in the research side.
Say if you need more info or contacts.
240
mareeS. Thank you. I’ll be sending you an email. We have had other people in a few places around Australia offer us copies of original records, so if anyone else is reading feel free to speak up too :- ) Yes, we are interested.
171
Hi Maree
Thanks so much for all this information. Right at this moment I don’t have the time to pursue the issue of the Nobby’s archives. I’m actually travelling north (to Rockhampton) not south to Newcastle today… from Noosa. Once I get a few things out of the way (including finishing drafts of two more potentially peer-reviewed papers and experimental work in Rockhampton) I shall my turn my attention to Nobby’s… at the same time I want to examine the Bathurst Gaol archives which are in Melbourne.
If in the meantime if someone has days to put side for this/getting access to archival boxes and then examining them… I’m keen to support them.
20
A couple of catalogue pages from State Records of NSW.
Search the old form ‘Concise Guide to the State Archives of New South Wales, 3rd Edition 2000’
http://search.records.nsw.gov.au/search …. put ‘weather’ in the search keyword
One item as an example – ‘Daily weather report [Newcastle], 1873 ro 1908‘
http://search.records.nsw.gov.au/series/4691
Search with keyword ‘temperature’ … found ‘Meteorological day books [Newcastle], 01/09/1881 to 13/10/1908‘ – http://search.records.nsw.gov.au/series/4689
Another possibility is the Newcastle regional archival holdings at either the Library or the University. http://libguides.newcastle.edu.au/archives
80
Jennifer says.
No not every way!
Try this. Click here
This should take you to the Raw data (CDO) Minimums.
Then from the drop down menu select “10th Percentile or less”. The period in question and a few years earlier will light up with colour. It is the coldest period in the minimums.
Now compare that to what happens if you do the same with the maximums.
Click here.
This should take you to the raw data (CDO) Maximums.
Select “90th percentile or more” from the drop down.
The period 1876 to 1888 will light up with colour.
This is misleading if there was a Glaisher stand on that site because the high maximums would have been recorded much higher (on sunny days) for one of those than a Stevenson screen (perhaps 1 or 2 full degree C). To be fair mimimums can also read lower in the Glaisher but not by as much and the modern AWS can read different due to differing thermal time constants.
I do not know what type of stand was there but what can clearly be seen from both the maximums and the minimums is amplitude modulation in the extreme range of the thermometer. Natural variation was larger back then than we are led to think and there was rapid warming and cooling again before the lovely life giving non pollutant plant food gas we exhale could be blamed.
I have assisted Jennifer on one of her digging trips to the Chester Hill archives and think she is doing an excellent job.
97% consensus = fools seldom differ.
Lance Pidgeon.
100
Lance
“97% consensus = fools seldom differ.”
Or as Baxter Black puts it
“If two fellas never argue it jus’ means one of ’em’s doin’ all the thinkin'”
100
Lance.
I was meaning which ever way you look at the TMax data!
A post discussing how understanding max and mins gives much more insight than calculating the mean is perhaps in order. Indeed during drought clear skies at night make it cold, while clear skies during the day make it hot. Even if it was cold at night, that doesn’t mean it wasn’t hot during the day.
As regards Glashier stands and adjustments, we need a clever engineering type (or two) who understands heating and cooling to start reading the large literature on different structures that have been used over the years to house thermometers and the amounts by which adjustments can/should/could be made. There has so much work that has been done on this. It needs someone with a physical sciences background to be able to understand and argue, for example, how having a floor and a roof affects night temperatures etcetera… or not. But they should start with the literature. I’m happy to give almost anyone access to a Dropbox with some of these papers.
Also, I very much doubt Nobby’s ever had a Glashier. They were used in Adelaide (and England), but in northern latitudes NSW and Queensland, smart guys like Clement Wragge understood their limitations and didn’t install them… that is my impression. Happy to be proven wrong. Maybe. 😉
Also, Lance. Thanks for sharing breakfast in Bankstown and the lift to and from the National Archive in Chester Hill when we went in search of Bathurst Ag data. You are a champion!
40
You probably could do a model, however wouldn’t it be better to run an experiment, build duplicates of all the structures and place them side by side for a year in strategic places with a modern electronic thermometer inside, then you could get a handle on the differences including any lag or thermal inertia they introduce. That’s how I would do it anyway
20
Thanks Jennifer
For me that was a fun day out!
I have a lot of info about the long running Screen comparison at Adelaide. I will get some to you soon. It shows how you could be even more right than you think about the maximums from a house. I can say now that the monthly average maximums from the house at Adelaide during 1896 read nearly exactly the same as the Stevenson screen next to it. The Stevenson screen however may have been reading a bit too low.
http://joannenova.com.au/2014/01/forgotten-historic-hot-temperatures-recorded-with-detail-and-care-in-adelaide/
Bobl
I would love to see the West Terrace site reconstructed as close as possible to how it was with all stands and an added modern AWS running side by side again….permanently. Sir Charles Todd did exactly what you describe for many decades there and it was carried on long after his death.
00
The best search at the National Archives website is to use the word “meteorological”, the name of the station and the year in the advanced search window.
There is a series B5311 held at the archives in North Melbourne, “Volumes of meteorological observation station information” . This has 1800 folios in 3 volumes. This has station information from 1856 to 1930. There is also a series B5312 which indexes B5311. This series is open access, meaning there are no restrictions on access to these records. Later records are probably available at the BOM library.
There is also a series B6501 with 63m of Meterorological observations! (ie they would stack about 20 storeys high) It might be informative to look directly at these records. This series is listed for access as “Not Yet Examined”. This means that nobody has recently asked to access them and you need to apply to have these examined and checked against the Act before you can examine them.
Ideally these should be digitized.
There are other records going all the way back to the first fleet and the early colonial period, some of these are summarized in the government gazettes. The original records may be in state archives or in colonial archives in London.
As an aside: I am only guessing but I have a feeling that the BOM homogonizes it’s data against other homogonized data. ie Rather than continually start from first principles for each station, they start with a record or series of records that they are happy with and use this as a basis to check and adjust further records. My guess is that their algorythms have an in built circularity. Ideally a whole new methodology needs to be developed that can synthesize the complete climate record and not just selected stations.
00
I have done some work on various aspects of NSW history in the 1880s-1890s, and it was frequently noted that many places mention a lack of water for farming, and warm conditions during this time. It is well recorded in many histories. Early 1880s and mid to late 1890s was frequently mentioned as warm and also dry, in southern NSW, that I remember.
Just a note on the good work here.
60
I’m pleased that you find the Trove records helpful.
50
In 1893 a cyclone crossed the coast at Rockhampton in early February, it gave Gympie a February rainfall of 933.9mm and a yearly total of 2.246m. Both remain the record to date. The cyclone continued down to Brisbane and near the end of February another cyclone crossed the coast at Brisbane. The two cyclones gave Brisbane a February rainfall of 1211mm and a yearly rainfall of 2.480m – both remain records for Brisbane. Most of the towns in that region Rockhampton to south of Lismore still have February 1893 as their highest rainfall record. Lismore had 799mm in February and a yearly total of 2.213m – still the record for both.
90
Yamba Pilot Station in Northern NSW is another station like Nobby’s, out on a point at the mouth of a river. It has a similar max temp chart to Nobby’s and starts in 1877. ALL the record months and the record year occurred in the 3 years between 1884 and 1886.
http://www.bom.gov.au/jsp/ncc/cdio/weatherData/av?p_display_type=dataGraph&p_stn_num=058012&p_nccObsCode=36&p_month=13
70
So once more they do their thing. 🙁
I’m left wondering — if both records were simply kept unmodified and reported, which one would be the more useful? And why would you care unless you live near one point or the other or you have an unscrupulous motive. It simply demonstrates that temperatures will not be the same at two different places, sometimes even places close together. What more can you say about it?
I don’t know how they get global warming from any of it. So why not keep and report the trends at both Nobby’s Signal Station and the RAAF base and be done with it?
Goofy, as always.
70
Cape Otway Lighthouse is a clear example of where pre-1900 max temp adjustments may be justified (there seems to be at least one sudden and large drop in temperature):
http://www.bom.gov.au/jsp/ncc/cdio/weatherData/av?p_display_type=dataGraph&p_stn_num=90015&p_nccObsCode=36&p_month=13
But I suspect Torok went too far in his thesis, in which it got converted into a perfect hockey-stick via comparisons with neighbouring sites, which must be very dubious for a lighthouse, unless other nearby lighthouses were used.
50
OMG, CAGW has caused a REDUCTION in storminess in SE Australia since the late 19th century, see this paper (used Cape Otway data):
http://www.bom.gov.au/amm/docs/2011/alexander.pdf
60
I would remind readers that what is happening with the BOM is not without precedent.
The Hadley Research Centre and the Climatic Research Unit at East Anglia University is charged with producing the global temperature record. The two main surface temperature records referred to by the IPCC and climate scientists around the world are HADCRUT3 and HADCRUT4. Neither of which incidentally show any statistically significant warming since 1998 – and that is the ‘mountains of objective data’ you refer to Jexpat! Hardly compelling evidence of dangerous man made global warming since human CO2 emissions have increased exponentially since 1998. Which is of course why the ‘consensus’ of over 100 climate models are miles off in predicting current surface temperatures.
But getting back to the CRU: in the late 2000’s many researchers “requested the CRU release the data that underlie its analysis of global temperature trends. Such a request should not at all be controversial. Indeed the atmospheric sciences community went to great lengths in the 1990s to ensure that such data would be openly available for research purposes, culminating in World Meteorological Organization (WMO)Resolution 40 on the international exchange of meteorological and related data and products.
Obviously, the ability to do good research depends upon good data with known provenance. At the time WMO Resolution 40 was widely hailed in the atmospheric sciences community as a major step forward in data sharing and availability in support of both operations and research.
However the CRU went through all sorts of contortions to avoid releasing it’s climate data to researchers including the irrepressible Steve McIntyre at Climate Audit.
“They first told him that he couldn’t have it because he was not an academic.” So world renown climate professor Roger Pielke asked CRU for the data as he is a “real” academic. He received a letter back from CRU stating that he couldn’t have the data because “we do not hold the requested information.”
Pielke and others wondered how the CRU could not hold the data when they are showing graphs of global temperatures on their webpage?
The CRU later put on their webpage a message:
“We are not in a position to supply data for a particular country not covered by the example agreements referred to earlier, as we have never had sufficient resources to keep track of the exact source of each individual monthly value. Since the 1980s, we have merged the data we have received into existing series or begun new ones, so it is impossible to say if all stations within a particular country or if all of an individual record should be freely available. Data storage availability in the 1980s meant that we were not able to keep the multiple sources for some sites, only the station series after adjustment for homogeneity issues. We, therefore, do not hold the original raw data but only the value-added (i.e. quality controlled and homogenized) data.”
Remember, this is the CRU, the GLOBAL equivalent to our BOM! This meant that the world were unable to audit the homogenised and adjusted temperature data being used by the IPCC and all climate scientists around the world.
Following this admission and the embarrassing revelations from the Climategate emails the UK Met office, which was responsible for the CRU, announced in Dec 2009, plans to re-examine 160 years of global temperature data. They indicated the new analysis would take at least 3 years. This they indicated meant that the Met Office will not be able to state with absolute confidence the extent of the warming trend until this work is done.
I haven’t followed what happened to this review, but perhaps it is not a coincidence that in January 2013 the UK MET office released an updated report confirming that they believe the hottest day in the last 160 years was in 1998, that there had been no statistically significant warming since then, and that they were not expecting any warming to continue until at least 2017 – giving us a non-warming period of 20 years – inconsistent with previous predictions.
What happens by then remains to be seen, but it shouldn’t be surprising if the world does return to the climate optimums enjoyed during the Medieval Warm Period, The Roman Warm Period and the Minoan Warm Period where humans, and life on the Earth thrived and where it was warmer than today.
Unfortunately it does seem that there is a great deal of scientific support for cooling due to the lowest levels of solar activity seen in the last 400 years. The world would not be a happier place at pre-industrial global temperatures.
Meanwhile the BOM should cough up the adjustment and homogenisation records before they too accidentally delete or misplace it like their colleagues at the CRU!
112
An Inconvenient Truth
The Broken Hill hospital is leading talks on ways to begin preparing as climate change impacts the far west.
The Far West Local Health District hosted a weekend forum on the issue led by Climate Council chief and former Australian of the Year Tim Flannery.
Professor Flannery said impacts of the warming trend are already being felt in inland Australia.
“I think regional Australia’s already bearing the brunt of our (homogenised) changing climate,” he said.
More than 20 participants from far west New South Wales attended the workshop, some of those travelling hours from rural properties in the region.
Lynne Gall from Langarwirra Station, 120 kilometres from Broken Hill, says the forum was a good opportunity to think about climate change and to ask questions.
“I hadn’t thought about it a great deal, that’s why I’ve come here today to learn something about it,” she said.
“Interestingly enough, I’ve got a diary written by a woman who lived in this area in the early 1800s.
“It’s her personal observations on her life and on the climate over five years. and I’ve noticed the weather conditions are remarkably similar to what we’re experiencing today.”
http://www.abc.net.au/news/2014-09-16/broken-hill-hospital-prepares-for-climate-change-in-the-bush/5746286
More inconvenient observations @ link.
121
OT. Will Steffen has taken time from standing in line at Centerlink to pen this scare mongering nonsense about Australia disappearing under the waves.
ABC is singing its praises already.
So little science, so much nonsense.
http://www.abc.net.au/news/2014-09-17/sea-level-rises-will-cost-australia-billions-report/5748676
80
At Fort Denison , Sydney Harbour, the sea level rise is 0.65mm/year.
Even if it continues at this rapid rate, that is only 55mm by 2010. !
I think we can cope.
Steffen can go take a long walk of a short pier !!
[I assume you meant 2100 Griss. – Mod]
61
My partner observed that anyone who’s property is catastrophically affected by 1m over 100 years was probably living waaay to close to the water.
60
I lived in Holland for 13 years – a large chunk of that country lies below sea level. Somehow the Dutch manage and thrive quite well.
Anybody here surprised that the ABC ran another piece of alarmist climate claptrap? Yeah, me neither… What is refreshing is to see the first few comments all bagging Flannery & Hughes. Could teh tide of opinion be turning at the ABC? Yeah, not holding my breath on that one either…
20
Just think of the boost to the economy if the seas did rise,all those dykes that would need to be built and the new suburbs built further out.
We have more of a chance of a big lump of ice/rock hitting the earth causing a massive tsunami than CAGW.
Beside where’s their faith,don’t they believe in Gaia,isn’t CAGW Gaia’s revenge on us pitiful human parasites who have bespoiled her domain?
00
Safetyguy66 –
i woke up to this statement on ABC News Radio this morning (from your ABC link) –
Professor Steffen said so-called once-in-a-lifetime natural events could become regular occurrences.
“If you look at some of our most vulnerable areas, and the Sydney region is one of those, you would say toward the end of this century that a one-in-100-year flood is going to be happening every few days,” he said.
“That’s an impossible situation to cope with.”…
btw some of this thread might find this worth checking:
2 Sept: Bob Beale: A hot spell, forever
This article was originally published in Good Weekend on November 28th, 1987.
Whatever the reasons for its low profile since the 1970s, the greenhouse effect is back to haunt us in the late 1980s. This time, the scientists are armed with better evidence, tighter predictions and a more cohesive voice. And their message is that, although it will probably not be the global disaster some doom watchers once claimed, the greenhouse effect is no longer an idea but an inevitability and it has probably already begun…
But, significantly, there are still strong dissenters from the mainstream scientific view. Academics such as Dr Ed Bryant, a Wollongong University geographer, argue that the predictions of dramatic change are based on simplistic computer models that don’t take account of some important factors in the complex web of forces that shape global climate…
***The Age’s science writer, Graeme O’Neill, summed it up this way: “We are locked into a runaway experiment in remodelling our planet’s climate, set in motion by our industrious great grandfathers and given powerful impetus by the energy-hungry generations of the present century. Our grandchildren will live with its consequences.”…
A key ingredient in the experiment is carbon dioxide, the gas we are all familiar with as the bubbles in fizzy soft drinks. It is released into the air every time we burn a fossil fuel. Every wood fire, car engine, coal-fired power station and factory using natural gas contributes. Fossil-fuel burning now pumps out 18 billion tonnes of carbon dioxide every year…
http://www.smh.com.au/good-weekend/gw-classics/a-hot-spell-forever-20140916-10bk11.html
***interesting to check out Graeme O’Neill’s LinkedIn. seems he wrote the above in his first year at The Age:
LinkedIn: Graeme O’Neill
Science writer Ecos Magazine, CSIRO Publishing
Government Agency; 5001-10,000 employees; Research industry
1980 – Present (34 years)…
Science, medical writer – The Age
April 1987 – March 1993…
Media liaison – CSIRO
1975 – 1984
http://au.linkedin.com/pub/graeme-o-neill/7/44a/a82
50
Flooding every couple of days?
Will has made me wish for better medicine associated with longevity, because I would like him to be around to see how wrong he is.
60
If they end up getting “once in a hundred year floods” regularly wouldn’t they then become normal weather conditions for the day?
Speaking as a Victorian,Sydney getting washed away is a problem…how?
00
It doesn’t rain every few days, therefor it can’t flood every few days.
Unless he’s thinking that tides will cause the flooding, in which case it’ll flood twice a day.
I can’t figure out how he gets flooding every couple days.
20
But don’t forget it will be a warmer, wetter world.
https://twitter.com/senatormilne/status/432811290893893632
Where not enough rain falls.
http://www.abc.net.au/landline/content/2006/s1844398.htm
And snow is a thing of the past.
http://www.abc.net.au/news/2014-08-01/storm-clean-up-continues-with-more-wintry-weather-forecast/5640032
Seriously, its descending, if not descended into high farce. Kenneth Williams could have done climate science if he was still around. He makes a lot more sense than Will, Timeh, Christine or any of them.
10
Cold weather delays cherry flowering
http://www.abc.net.au/news/2014-09-16/cold-weather-delays-cherry-flowering/5746406
“The late cold weather we had in July and August held them back and as a result we’ve just got that extra chill, which I think has helped them come out much more evenly,” he said.
BoM:
“National temperature outlook
Issued 24 July 2014
Warmer days more likely for east, north and southwest
http://www.bom.gov.au/climate/ahead/archive/temperature/20140724.temp.shtml
BoM asks & answers: How accurate is the outlook?
Moderate to high over the northern half of Australia, most of SA, and Tasmania
10
Here is an update from jonova’s last post on record Antarctic ice:
Swedes discover rare Antarctic fossils
“Researchers believe the animals lived on the ice-covered continent between 65 and 35 million years ago, when the climate was much warmer than it is today.
“This exciting discovery pushes forward our knowledge about the previous inhabitants of the Antarctic,” said Mörs.”
http://m.thelocal.se//20140916/swedes-discover-rare-antarctic-fossil
. . .
I checked with skeptical science.
It’s number 1 on climate myths.
Maybe John Cook could do 97 hours of drawing cartoons of the mammals driving their SUVs.
40
btw in Graeme O’Neill’s 1987 Age article, it was nice to see Dr Ed Bryant being described as one of the DISSENTERS.
these days, if u don’t believe even the absurdity of the following, u will undoubtedly be called a DENIER:
15 Sept: AOL: Ryan Gorman: Global warming likely to cause colder and snowier winters, scientists say
Scientists now believe that global warming is to blame for extreme cold snaps in North America during the winter months – and that it will only keep happening…
A team of Korean and American scientists asserted in a new study that the melting ice causes the northern jet stream (upper level air flow) to shift south and bring polar air with it…
The Eurasian supercontinent also experiences this cooling effect, according to study co-author Seong-Joon Kim.
Kim told Slate the three-year study was inspired by two record-breaking cold snaps over the past decade in his native Korea.
He also blamed a number of other factors, but said the loss of Arctic Sea ice is serving only to intensify the phenomenon…
http://www.aol.com/article/2014/09/15/global-warming-likely-to-cause-colder-and-snowier-winters/20962706/
30
Sounds like excuse #53 🙂
50
Averages. It all seems to be about fiddling the averages and trends to argue over what are obviously very slight trends and whether they might point up or down. It you start at the right point, you can create either direction, as in the graph above.
However do averages actually mean anything? Apart from the sea rises after the ice age, sea rises which cannot affect us for centuries if ever, what is the actual problem with averages? The cities like Rome are climbing into the air, ten metres above ancient Rome, buried under the sands of North Africa. Even Beijing rises 1cm a year with dust from the Gobi. Everything moves slowly. Stockholm was moved because their land is rising quickly, destroying boat access. England and Scotland are going up, springing back after the ice age. So why are we worried?
Who needs to know an average temperature across winter and summer, night an day, arctic to the equator? Who lives in this average? Who cares?
Look at the tropics. At 32C every day, it just gets wetter, not hotter. In the arctic and latitudes 40 and below, nature completely shuts down, so what does the cold matter? Leaves fall from the trees. Bears hibernate. Nothing grows. Nature hides and the whole Northern world lives for that three months of long nights and warm days. A normal winter would be classified a natural disaster for much of North America and all of Canada. Who would not want it sunnier and a bit warmer, to extend the growing season? Who really wants the glaciers back? Who really wants Europe and North America covered in ice all year?
So Who is pushing tiny trends in these meaningless averages, in which no one lives. Like a stopped clock, an average might be right twice a day. Who received average rainfall every year? Who gets an average number of rainy or cloudy days? Or even an average number of hurricanes? Why does new England care about Punxsutawney Phil, who should according to our new climate scientists should turn up on the same day every year. Climate variation is perfectly normal.
Are these averages even meaningful in a single location, like the terrible winters which killed Napoleon’s Grand Armee in 1812 outside Moscow or the equally terrible winter which destroyed the Wehrmacht outside Stalingrad in 1943? They experienced an ‘exteme event’, an extremely cold winter but was it someone’s fault? What about ice skating on the Thames? What else can you do with ice? Before refrigeration, the Tudors of Maryland sold ice blocks around the world, even to India. It is useless stuff but their farms in Maryland were completely useless in winter. So if you had ice in Bermuda in your drink, it was Maryland ice.
This desperate fiddling of temperatures, fudging of trends and averages in such tiny amounts are quite meaningless to existence. Bring on the warmer, longer summers and sure, make the winters a bit cooler if we must. Who cares about winter in most of the world? In the arctic, nothing much happens. In the near tropics, it is a relief.
No, this huge industry of averages is meaningless, created only to allow people to talk about Global Warming and all that has been proven for trillions of dollars is that some manufactured and largely meaningless global average has stopped moving slightly upwards and may be going down next. We can get the temperature of the planet as a black body radiator and it is fine.
This is not science. This is a deliberate perversion of science to create a world where one day must be identical to the last or it is someone’s fault and a government tax must punish the offender. It is a politically and fiscally motivated non scientific madness pushed on the world as serious science. To think that the BOM actually have even created an average temperature for Australia, a most useless measure of anything, is itself madness. So what if the far North had a hot summer? It happens. We can have a hot summer, a cold one, a wet one, a dry one, but somehow as we sit in our average sized houses in our averages suburbs, with our identical clothes and food and 2.5 children, we should be scared of anyone or anything which is not average. Bring on the taxes.
The debate should be, if we could actually change local climates, even global climates, should we? I think the world would vote for warmer.
It would be great for the world to have hotter summers and cooler winters, so that the average did not change. We would be weather extremists though. So how is that summer beach house going Tim Flannery? It’s nice to have a warm summer, relaxing at the beach? Or would you rather be colder, on average?
200
TdeF, I would like to repost a version of this at my blog/at least an extract. Your permission?
81
Certainly.
40
Nice TdeF
I always say the point of an average is that half the numbers are lower and half are higher so the number in the middle is pretty pointless to compare against and get upset if its different.
unless you run 3 standard deviations around the middle number and then you can make an assessment of whether the number is extreme or otherwise.
One thing that always amazes me is the reporting of a temperature anomaly which is the temp referenced to a moving average of 30 years. Change the length of the MA and you get a completely different result. I believe it is a flawed measure.
If the past was hotter without CO2 whether that is the 1930’s in the US or late 1800’s in Australia then no measure or torture of the data is going to alter the fact that CO2 does not drive temperature.
The temp rise up to the 1990’s was neither unprecedented or a maximum temperature in global history.
The models have been curve fitted to CO2 which if you do that with a trading system always ends in tears and an empty bank balance and the climate models are no different.
If the adjustments that have been made to the temperature record had been made to financial data then a lot of people would be in prison following in the footsteps of the Enron exec’s.
90
“…an average is that half the numbers are lower and half are higher…”
Oopps no that’s the median
00
They even have the concept of “area averaged” daily mean, which appears to be sort of legitimate given the number of stations (over 700) scattered around the country, but when they backdate it to 1910 when there were only a handful of stations, well it gets a bit too much.
20
Establising this temperature average must be far worse than a normal average, at a minimum a sum divided by the number of sampling stations. If you were looking for radiant flux, you would consider a weighting by area, divided by maybe halfway to the next measurement station regardless of geography. Then you might give lower weightings for being near water, allowing for cooling effects or in a valley. Then you might have an average weighted by population density for a different purpose or by many other things. The question is what you are trying to establish, a temperature which is an absolute measure of radiative balance, a temperature where people live, a temperature which is somehow pure and unsullied by natural effects or even some other type of average temperature.
The very idea of a single representative temperature half way between Cable Beach and Hobart which purports to be the temperature of Alice Springs is just silly when you know the temperature of Alice Springs. How can anyone seriously suggest the temperature of Alice Springs can be calculated this way, no matter how complex the algorithm?
Then you get the bias for higher numbers as the numbers are not far from 0. Thus 30 to 33 is far less significant than 0 to 3. Near water, thanks to the latent heat of the ice/water transition, cooling would be hidden at the bottom end, giving a natural bias to warmer conditions when in fact things were cooling. Basically it is warmer by the sea with cooler summers and warmer winters. How do you cope with this in an average?
Meteorology might be a specialized discipline, but in normal science you cannot change raw data at all except for equipment failures. It all seems like some sort of global game, even stranger when two thirds of the planet is covered with water anyway and so much is still uninhabited and many places unmetered for long periods or at all. The very idea of a representative average has so many inbuilt presumptions that you have to be very careful not to build in prejudices and preformed conclusions. There needs to be a serious concern that even without intentional bias and well meaning but perhaps misguided adjustment, the whole area is heading for accusations of bias or even lack of real meaning. If possible averages should be over the longest possible time anyway, to eliminate cyclical behavior but that has not been done in this specific case at Newcastle. You have to ask why?
20
Last year I devised my own project, at a level I called “high school standard” to see if I could reproduce the BOM’s daily mean for Tmax for Australia and each state and the NT. I ignored all the things you raise BUT I did adjust for longitudinal divergence at the suggestion of Geoff Sherrington. I was able to match the BOM’s results very well for 2012 and 2013 and validated their claim that 7th January 2013 was Australia’s hottest day ever by doing the same for the previous record set in December 1972.
But you are right, what does it actually mean?
As part of that I had some fun with Alice Springs, estimating its Tmax from past data of three other stations forming a triangle for the period 2010-2012, which is 1096 days. I did it for five sets of ever increasing triangles, finishing with the ridiculous Perth-Darwin-Melbourne trio to estimate its Tmax.
The following results were obtained:
1. Perth-Darwin-Melbourne
Area = 3431920 square km, #days = 1095, median daily error = -0.81C, standard deviation = 5.67C
2. Kalgoorlie-Tindall-Mildura
1985045, 1078, 0.97C, 4.41C
3. Warburton-Tennant Creek-Moomba
580258, 1083, 1.92C, 2.59C
4. Territory Grape Farm-Jervois-Kulgera
49351, 948, 0.75C, 1.41C
5. Territory Grape Farm-Artlunga-Kulgera
22018, 930, 0.08C, 1.20C
Note (1) # days is when all three stations have an observation.
Note (2) negative median is an overestimate, positive median an underestimate
This proves the obvious, that nearby stations are better than ones further away for estimating a temperature, but nevertheless distant ones can produce a figure. I suspect on the global level the STD for many estimates would be more than the 5.67C measured for Alice Springs from the capital cities.
30
Love your work. A Perth Darwin Melbourne triangle! Now that’s impressive interpolation and very silly scientifically even if perfectly valid mathematically, as you know. What else can you do if that is all you have? Linear interpolation reigns supreme and as you point out, is incredibly not too bad, even over thousands of kilometers and twenty five degrees of latitude. Maybe what we see as hugely significant differences in temperature in human terms are not so big in real terms, like the difference between 27C and 37C. I would think though to actually prefer and present the projected temperature of Alice Springs as the actual temperature of Alice Springs is something else. As far as I can tell, that is what is done. I have no idea why but think the worst of this mysterious homogenization which not only changes temperatures where measurements are valid, but even changes long term trends.
20
Love it, TDeF
To sum up weather-wise, being average is not normal.
10
TdeF, that’s quite lyrical. Thank you.
10
Just replace the words “human excretion” with “Global Warming”.
Uma says ‘human excretion’ caused U’khand floods
“A year after floods devastated Kedarnath, Union water resources minister Uma Bharti has revealed the “underlying” cause of the disaster —
defecation near the shrine by non-believers.”
http://www.hindustantimes.com/india-news/uma-bharti-says-human-excretion-caused-u-khand-floods/article1-1264697.aspx
. . .
The smell is the same.
20
S**t happens!
10
The Climate Council’s new report on coastal flooding and 21st century SLR is being promoted loudly today by their ABC. Here is the six main points—————–
READ THE REPORT
SIX KEY FINDINGS
1Sea level has already risen and continues to rise due to climate change. Climate change exacerbates coastal flooding from a storm surge as the storm rides on higher sea levels.
2Australia is highly vulnerable to increasing coastal flooding because our cities, towns and critical infrastructure are mainly located on the coast. Australia’s infrastructure has been built for the climate of the 20th century and is unprepared for rising sea level.
3Coastal flooding is a sleeping giant. If the threat of sea level rise is ignored, the projected increases in economic damage caused by coastal flooding are massive.
4Rising sea levels pose risks for many of Australia’s species and iconic natural places, such as Kakadu National Park and the Great Barrier Reef.
5Rising sea level is eroding the viability of coastal communities on islands in the Torres Strait and the Pacific, and in low-lying areas of Asia, increasing the likelihood of migration and resettlement.
6We need deep and urgent cuts in greenhouse gas emissions this decade and beyond if we are to avoid the most serious risks from rising sea levels and coastal flooding.
READ THE REPORT
Unbelievably these liars are telling the OZ people that we can make a change if we make deep cuts to our bee’s dick sized co2 emissions. Point 6 says we can avoid the most serious risks from SLR and coastal flooding if we make these deep cuts. And this is supposed to be based on their best science? What a hopeless mob of fools.
60
Yes, Neville, they are getting desperate – the longer we don’t do anything the more likely their timeframes for catastrophy will complete without catastrophy.
No catastrophy – no money – no power – no preferred partner of choice…
20
Re #25 Climate Council’s new report
>”6 We need deep and urgent cuts in greenhouse gas emissions this decade and beyond if we are to avoid the most serious risks from rising sea levels and coastal flooding.”
Reporting it, SMH says this (my emphasis):
“Sea levels have risen globally at a rate of about 3.2 millimetres a year over the past two decades. About 45 per cent of the increase has come from oceans expanding as they absorb more of the sun’s heat trapped by greenhouse gases, with most of the rest coming from the melting of ice from glaciers and the polar ice caps.”
Read more: http://www.smh.com.au/environment/climate-change/coastal-inundation-threat-rises-says-climate-council-20140916-10hqe6.html#ixzz3DYXBvXjl
The report states in 2. The science of
sea-level rise, page 7 (my emphasis):
“There is strong evidence that the
primary cause of the sea-level
rise observed during the past
half‑century was the warming of
the atmosphere and oceans due to
an increase in the concentration
of greenhouse gases in the
atmosphere (IPCC 2013).”
http://www.climatecouncil.org.au/uploads/56812f1261b168e02032126342619dad.pdf
Except, there is no “strong evidence”. IPCC AR5 2013 has no documented mechanism for anthropogenic ocean heating. Just the same speculation they have had for the last 25 years.
I’ve been taking Philip Shehan to task in the ‘Time travelling scientists’ thread for his casual dismissal of the scientific null hypothesis and in particular the null for CO2 (yes, there is one – see below). Latest repeated here:
>”To date Philip (AR5), after 25 years of reports the IPCC still does not have a documented mechanism for anthropogenic ocean heating. [All they state is supposition – “air-sea fluxes” – whatever that means radiatively or in terms of sensible heat i.e. they DO NOT HAVE an alternative hypothesis to the null, no empirical studies (evidence), nothing.]”
From ‘Null Hypothesis’ above:
“The ‘null’ often refers to the common view of something, while the alternative hypothesis is what the researcher really thinks is the cause of a phenomenon.”
Climate science, and thefeore the IPCC, does not have an alternative hypothesis (except speculation) for ocean heating by anthropogenic means.
But in ‘A Null Hypothesis For CO2′ [link below], which is essentially “the common view of something” as above, Dr Clark states (page 5):
“The solar heating of the ocean may be simulated using a simple Beer’s law model as illustrated in Figure 2.[page 6] This was used to determine ocean solar heating and cooling as a function of depth over a 1 year period at 30° latitude with the solar constant set to 1365 W.m-2. The model depth resolution was 1 m and the time step was 0.5 hours. The calculated results are shown in Figure 3 [page 7]. They are consistent with Argo Float data such as the examples shown in Figure 1. The model was then extended to simulate changes in the solar constant due to the sunspot cycle from 1650 to 2000 using a scale factor of 1 W.m-2 per 100 change in the annual sunspot index.11 The calculated change in ocean temperatures at 90 m depth is shown in Figure 4 [page 7]. There is a distinct decrease to the end of the Maunder Minimum followed by an overall increase of almost 0.5 C from 1750 to 2000. This simple model clearly demonstrates that small changes in the solar constant influence ocean temperatures and cause climate change.”
http://appinsys.com/GlobalWarming/EPA_Submission_RClark.pdf
Climate science (and therefore the IPCC) cannot demonstrate same with CO2. Given planetary energy flow is predominantly sun => ocean(+land) => atmosphere(+space), and the greater part of the planet’s accumulated energy is stored in the ocean (about 90%) not the atmosphere, an AGW hypothesis without an ocean heating mechanism is a non-starter.
And the null case for CO2 in respect to ocean heating remains valid.
http://joannenova.com.au/2014/09/scientists-invent-time-travelling-models-that-might-have-worked/#comment-1567339
# # #
Will Steffen, John Hunter, Lesley Hughes, and the IPCC, must first come up with an anthropogenic ocean heating hypothesis (mechanism, evidence, etc) long before they can make the claims they have because to do so the hypothesis must be thermodynamically sound i.e. based on principles of physics. Then pass observational scrutiny. And defeat competing alternative hypotheses. This hasn’t happened yet.
But their first hurdle is to falsify the null hypothesis for CO2 in respect to ocean heating which is thermodynamically and physically sound. No-one has done that either.
10
>Except, there is no “strong evidence”
There’s not even evidence, let alone “strong” evidence.
00
We know CO2 causes warming. We also know humans are producing CO2. Therefore, we know humans must be causing global warming. Therefore, it is entirely appropriate to adjust past temperature records to align with what we know to be true.
I think this is the way “climate science” works.
Climate science is the Farmer’s Almanac in a cheap tuxedo. The Farmer’s Almanac is much more entertaining.
32
So much focus goes into analysing the method by which the temperature “data” was transformed.
Little has been said by either side about the actual scientific usefulness of this data.
From a scientific point of view it is not much.
Each reading describes a moving feast of cloud cover, rain, residual moisture in air and soil etc and is invisibly linked to the physics of orbital mechanics on timescales unimaginably long.
The list is endless.
The situation is not something which can be analysed or meshed with anything else and is only relevant to that very spot on which the readings were taken.
Analysis coming from this data is of no real use so we now have a huge question.
WHY.
Why have people all around he world spent millions recycling and meshing and homogenising un-meshable data?
It cannot be used in models unless the model relates to the point of measurement and even then you have to ask what are you modeling.
You can’t “model” the weather; it’s too flakey.
The whole purpose of data meshing can only be to create a story, a story fit for a religion: Klimate Science .
How have they gotten away with it for so long?
Are all humans inherently stupid?
KK
30
Are all humans inherently stupid?
KK
No KK just scientists and politicians ,at least with politicians we get what we voted for.
Except for scientists who work in private industry the rest get their jobs from politicians ,so the onus is on us to elect politicians who don’t like or trust scientists.
10
as i don’t consider CAGW to be the problem, i don’t agree with Bailey’s own remedies, but some good stuff in here nonetheless:
2 pages: 16 Sept: Reason: Ronald Bailey: Naomi Klein Changes Nothing With This Changes Everything
The laws of nature do not mandate a progressive paradise.
(Review: This Changes Everything: Capitalism vs. the Climate, by Naomi Klein, Simon & Schuster, 576 pages, $30)
It bears mentioning, however, that the global average atmospheric temperature has not significantly increased for the past 17 years, a “pause” not predicted by the computer climate models…
Klein acknowledges that not all weather disasters can be attributed to climate change. But she doesn’t let that stop her from trotting out tragic stories of hurricanes, typhoons, and droughts to shore up her thesis. She quotes the Pennsylvania State University climatologist Michael Mann…
Well, if the world were to begin deploying these renewable energy technologies next year that would mean erecting approximately 250,000 wind turbines each year for the next 15 years. As of the end of 2012, there were a total of 225,000 wind turbines operating around the world.Similarly, the world would have to install 113 million rooftop solar panel systems per year in order to meet the 2030 goal of 1.7 billion…
***Klein never ever discusses how much her solutions to the climate crisis will cost. But Delucchi and Jacobson estimate a price tag of about $100 trillion for their program. That entails spending about $6.6 trillion per year from now until 2030, more than 11 percent of the entire world’s 2013 output of $75 trillion…
The installation of solar and wind energy systems has contributed to reducing Germany’s carbon dioxide emissions, but at an estimated cost of more than $1,000 per ton avoided by solar power and $80 per ton avoided by wind power. The average price for carbon dioxide emissions permits in Europe hover at about $20 per ton. Electricity rates this high might well be the price for protecting the climate, but Klein is keeping her readers in the dark about what her proposals would cost them…
http://reason.com/archives/2014/09/16/naomi-klein-changes-nothing
***numbers were never the CAGW crowd’s forte.
00
O/T … but you know when the UN has really jumped the shark on climate change when they are using star power to push the agenda:
http://www.theaustralian.com.au/news/world/leonardo-dicaprio-named-un-messenger-of-peace-for-climate/story-e6frg6so-1227061052448
Yes, they have elected UN Messengers of Peace … the likes of Clooney, DiCaprio, Stevie Wonder and Michael Douglas. Because actors are the best way to convince ordinary people that you are telling the truth I guess…
30
Fancy taking any notice of those assorted numbskulls. Just proves how really stupid a proportion of our population has become.
This so called star power makes me want to throw up. YUK.
10
He’s well qualified to be the Wold Peace Messanger too. I mean… Arabs? what?
20
Judith Curry tackles the fools and scientists who repeat stupid nonsense about so called CAGW. She shows intelligence and guts in this National press club address. More strength to her arm.
http://judithcurry.com/2014/09/16/jc-at-the-national-press-club/#more-16889
30
>”Note the trends…. adjusted of course.”
An interesting, but nonsensical exercise I put in front of the local warmist enclave of staunch NIWA supporters (Hot Topic) a while ago was to project the adjusted NZT7 linear trend (0.91 C/century) back in time to the Treaty of Waitangi signing in 1840 to arrive at average absolute temperatures back then.
The temperatures bore no similarity to even the earliest recordings in Dunedin (south end of South Island) in the mid-1800s. Such a cool regime was just not evident in NIWA’s CliFlo database. The Hot Topicers didn’t have much to say on that.
You can do the same for the Williamtown Mean Minimum graph above. 1.6 C/century back to say 1850 from 11 C in 1910 = 10 C. That puts 1850 at the bottom of the graph.
Given the Minimum regime of the last 30 years (raw and adjusted) was around 12.25 C. I think a Minimum regime 2.25 C cooler at 10 C back in 1850 would have made grape growing rather different then than it is now for example. Tasmania promotes itself as “The perfect location for producing premium cool-climate wines”:
http://investtasmania.com.au/__data/assets/pdf_file/0005/58370/Tasmania_Delivers_brochure_wine_A4.pdf
See page 2,
Growing days
This graph provides a comparison between
growing degree days (GDD) for Tasmanian
regions and a range of world wine regions.
GDD is defined as a seven month sum
above 10 degrees Celsius base temperature, October to April inclusive in the southern hemisphere, and April to October in the northern hemisphere.
The graph shows the GDD similarity
between Tasmanian wine producing regions
and world-renowned cool-climate regions
such as Champagne and Marlborough
Was that Newcastle in 1850?
00
From the Trewin report on ACORN-SAT techniques: http://www.cawcr.gov.au/publications/technicalreports/CTR_049.pdf
Near the end of the introduction to section 7 (homogenisation)
“The homogenisation process is a two-stage process;
first detecting all potential inhomogeneities, through the use of metadata and statistical methods,
and then making adjustments to the data to remove the impact of the identified inhomogeneities
and produce a homogeneous record.
The detection of inhomogeneities in a temperature record is a well-developed field of research
(see section 7.2) and the methods used in the construction of the ACORN-SAT data set are
closely based on those used previously for national-scale networks. However, adjustment of
data to remove inhomogeneities at the daily timescale is a much less developed field, with the
techniques used in ACORN-SAT not having been used outside Australia for a national-level data set.”
Pretty much 2 smoking guns there:
NO MANUAL CHECKING of detected homogeneities (i.e. it should be a 3 stage process);
NOBODY ELSE HAS USED THE ADJUSTMENT TECHNIQUES;
00
Section 7.3 (first sentence) confirms no manual checking:
“Once potential inhomogeneities have been identified , the next step is to adjust the data to remove the effect of the inhomogeneity.”
So all potentials are treated as actuals!
00
That’s right Mikky. I’m slowly checking vs comparison stations. Stay tuned for further developments.
10
Alice Springs is a very revealing example, used as a case history by Trewin (see section 10.6 of CTR_049.prf). It shows at least that BoM has done some analysis, but in this example the analysis may be faulty.
The step detection finds several steps that are correlated with changes in rainfall patterns, but BoM don’t allow those steps to remain in the data, they are all corrected, with the explanation being that vegetation changes have “corrupted” the thermometers.
Is it not more likely that the temperature steps simply reflect the weather changes associated with varying rainfall, the vegetation around the site also being just a consequence of those weather changes?
00
‘…, with the techniques used in ACORN-SAT not having been used outside Australia for a national-level data set.”
I thought the BoM has publicly stated that ACORN techniques have followed world-best practice.
If the BoM hasn’t, then maybe the techniques should be reviewed.
10
I think the techniques are like tools in a toolbox.
Buying a set of expensive tools does not change a novice to a master craftsman.
00
We should not be rejoicing in someone else’s misery,and I am surprised Jo that you have done this,though if they wanted to build it carbon neutral then they should have built it out of mud-brick.
Clever people often can’t see the wood for the trees(pardon pun).
00
Some heat has been generated in the local Newspaper online edition.
One of the regular contributors here has inspired a follow up article by one of the resident warmers who pulled out every cliche possible:
http://www.theherald.com.au/story/2567035/opinion-sceptics-sidestep-while-australia-burns/?cs=308
My comments;
Another extraordinary and tragic blow to modern science.
It is a well known fact among main stream scientists that “Climate Science” is a joke.
So called “Climate Scientists” may have degrees or even PhDs but they have almost no training in Mathematics, Physics, Chemistry, Geology and Astrophysics (orbital mechanics).
That’s for a start.
Any well trained scientist with training in “Modeling” knows that the claims to have modeled the relationship between Earth’s atmospheric temperature and Human Origin carbon Dioxide is ridiculous.
This whole business of man made global warming is a political construct and the only reason why anybody bothers with old data from the 1800s is not science but to fudge the data to make Global Warming appear out of no where.
In true science you cannot mesh one set of data from a weather station at a point A (say Nobby’s) with other data from point B (say the Islington site).
It’s OK in politics, religion and Global Warming to do that but not in the real world.
Criticism of Mr Cox’s very accurate work is just politics and people are become aware of this.
KK
01
the Griss has also commented ! 🙂
Not too rude, just forceful, but I Wonder how long it will stay there…
11
Hi
Are you one of the 5 or still in moderation?
GJ
00
looks like it 🙂
00
Well said. Concise.
00