
By Jo Nova
The Rainforest Reserves community group has achieved something that the Dept of Environment, Energy and Perfect-Weather has not been able to do.
Not only has Minister Chris Bowen not managed to create a map to show off his achievements, but nor has any other government agency. Even with a billion dollar budget, the CSIRO has not made a map so user friendly, helpful and informative, nor has the Australian Energy Market Operator (AEMO), the Australian Energy Regulator (AER), the Dept of Industry, Science and Resources (DISR), or the Australian Energy Market Commission (AEMC). Neither was the map done by the Clean Energy Finance Corporation (CEFC) and the Australian Renewable Energy Agency (ARENA), and the Climate Change Authority (CCA). It can’t be an accident… but it does look like The Blob doesn’t want to make it easy for Australians to know how vast these projects are.
ARENA got $7 billion to throw at renewable projects over 16 years. They and others, spent 3 million dollars mapping Australia to help renewables investors, but didn’t think to do a map to help Australian taxpayers? (The mapping project closed in 2021, and has now been sort of packed away.)
Usually when Ministers build industries they like to cut ribbons, wear hard-hats and brag to locals about how many jobs they are creating. Instead, it’s almost like the government doesn’t want Australians to know about all the Clean Green transformation.
Perhaps because it looks like this?

Clarke Creek Wind Turbines. Queensland. — Photo Steve Nowakowski
Australians wouldn’t be able to see this at all, if it wasn’t for Steve Nowakowski. Where was the ABC photography team? (Off having coffee in Ultimo and just being another billion dollar agency serving itself?)
From the press release: The Truth Map totals include:
- 31,000 wind turbine towers — six times the current national number to be replaced every 15-20 years, operating 30% – 40% of the time.
- 28,000 km of high-voltage transmission lines — longer than [half] a lap around the equator*.
- 7,800 km of undersea cabling — cutting through fragile marine habitats.
- 44,000 km of new haulage roads — longer than Australia’s coastline.
- 350–550 million solar grid panels covering 443,755 hectares — an area larger than metropolitan Sydney to be replaced every 25 years, operating 18% – 25% of the time.
- $1.38 trillion in total costs — overwhelmingly subsidised by taxpayers.
Caught short, Chris “Blackout” Bowen is dishing up the insults for The Australian and Rainforest Reserves.
A normal person might think the Minister for Better Weather would be delighted that volunteers have worked so hard to highlight his work and the glorious transition. Instead he made a social media post with petty insults, saying they vastly overestimated the footprint area, and were just anti-renewable, pro-nuclear activists, and the real area was only 12% as large.
Later it turned out the 12% figure came from a NSW state report and didn’t apply to the whole country. The Australian asked him to clarify, and he sent back a page of points that didn’t answer the question. The Australian prodded again, and this time the Minister’s team said the maps were inaccurate because 5 wind and 1 solar project are not proceeding. Which means, they used the recent renewables “drop outs” to attack the volunteers who had achieved more than 10 government agencies had done.
Meanwhile Rainforest Reserves said they’ve added in some new projects since it was released a few days ago, and the footprint is growing. Bowen’s team said it was “replete with errors” but didn’t explain any. (If only the Minister had an up-to-date map!).
Steve Nowakowski said that Rainforest Reserves keep the withdrawn projects on the database because they often restart in a new form later with a new investor.
Because this map was done by volunteers, there are some projects that are missing and some that have been shifted or canceled. Footprints are often moving, and investors are also running away as they see how angry the protesting farmers are, how expensive the electricity is to build things in Australia, and how delayed every transmission line is. Rainforest Reserves invites people to send in corrections and suggestions.
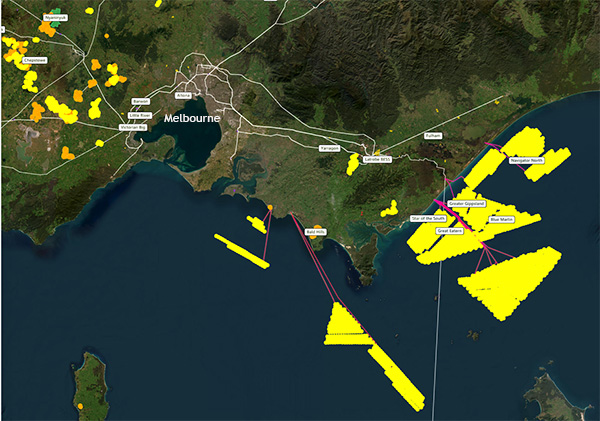
A few examples I took from the map: The view around Melbourne:
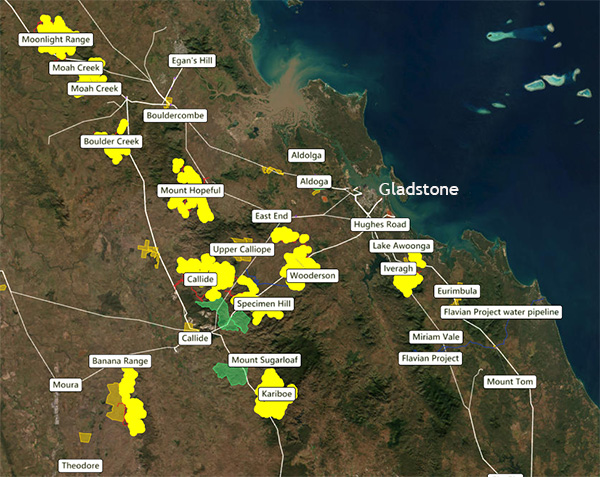
The area near Gladstone in Queensland:
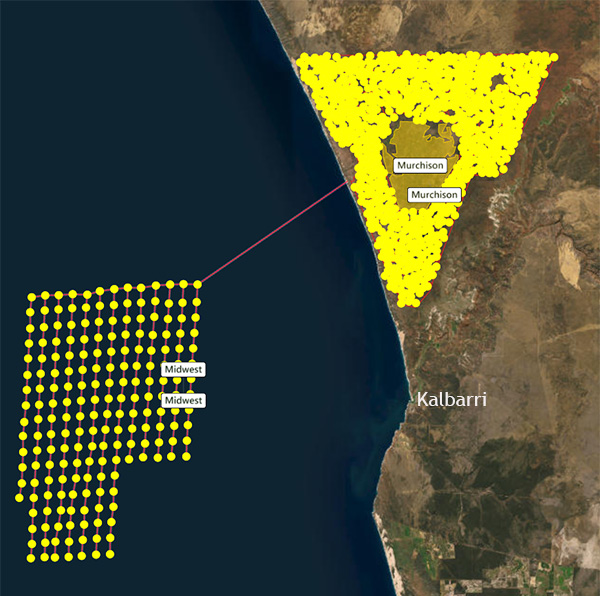
And the giant near Kalbarri in WA. Investors in Denmark have recently abandoned the offshore wind project in this map. But the land based “hydrogen” plant north of the town is still going ahead. They plan to build 500 wind turbines and 10,000 hectares of solar panels, and the government just gave them $814 million dollars of our money to help the foreign investors make a profit.
The small town has a population of about 1,500, and the petition to oppose it had already gathered 4,197 signatures. We could add a few more.
Even if a project has been cancelled, you know the government wants it to be there…
The Rainforest Reserves site and Rainforest Reserves on X
* Corrected the Press Release. 28,000 km is only two thirds of the way around the equator.


Australia has bats in it’s belfry. I need to stop reading things like this as it depresses me to watch what future I am handing my Grand Children. They have to pay for these boondoggles, they’ll have to struggle for work, they’ll have to fight environmental battles we thought we had already won.
690
Hi Jo,
Your list of Truth Map totals above should include the rest of the essential items to actually keep our power grid;
• Snowy Hydro 2, a Turncoat tragedy
• A battery of useless, expensive batteries
• Coal fired power stations, the forgotten, neglected heroes
• Gas fired power stations which is actually all we needed with Coal!
561
Hi Jo,
it would be interesting to do another map with coal fired power stations and their footprint.
that way a direct comparison of the space taken up can be shown.
Victoria would be a great example as the coal mines were right next to the power stations.
500
260
Okay then.
See that middle map showing the area around Gladstone.
(and I hope I can explain this okay)
Locate the lower Aldoga, the closer of the two of them to Gladstone.
See where the white line forms a sort of a small slightly tipped over ‘Z’ between Aldoga and the letter ‘G’ for the Title Gladstone. The top of the ‘z’ ends at the water. Well, that’s where the Calliope River flows into that water body there.
Now, see the point of that ‘z’ closest to the word Aldoga.
That’s where the Gladstone coal fired power plant is located.
Now see that word ….. Gladstone. See the white letter ‘a’. The bottom part of that letter ‘a’ is a closed circle. The small black part in the middle of that lower part of that letter ‘a’ is about twice the size of the Gladstone coal fired power plant. It would show up as a white dot similar in size to a full stop.
Only Yallourn W is older than Gladstone, albeit just by one year, as Gladstone first generated power in 1976, so all but 50 years old now. It has six Units and a total Nameplate of 1680MW.
Queensland has a total Nameplate for Wind Generation of 1934MW, so a 15% higher Nameplate than this Gladstone coal fired plant.
Last year wind in Queensland delivered 2877GWH of energy to the Queensland grid.
This ancient time expired stranded asset dinosaur of a coal fired power plant delivered 6409GWH of power to the same grid, so 2.23 times the total energy than from those six wind plants. Only the power not being used by the Boyne Smelter goes to the grid.
Those Industrial Wind Plants dream about having a life expectancy of ….. HALF this clunker!
Tony.
390
Well perhaps maybe a letter S and not a Z, so say a backward Z.
See how I said I hope I can explain this okay.
See now just how little space is taken up by coal fired power plants.
Tony.
200
I saw a nuclear plant in France last year. The biggest structures were the cooling towers. The largest area was the car park. The reactor buildings were small by comparison. The power station was called Bugey. It occupies 100 ha and is located cheek by jowl with the township. It is 53 years old and produces an annual net output of 25,654 GW·h, nearly 10 times the output of Queensland’s wind.
https://upload.wikimedia.org/wikipedia/commons/1/18/Centrale-nucleaire-Bugey.jpg
The locals all seemed quite normal and there were no three eyed fish in the Rhone river which supplies some of the cooling.
290
I like the two headed fish that swim around the outlets of nuclear plants on Lake Ontario! They are great for fishermen. Twice the chance of a fish biting on the hook!
20
And the Callide Mine, which, according to Open electricity.org.au is what supplies coal to Gladstone Power station takes up an area roughly the same as the Gladstone city, about 12x8km. Which still, bang for buck for power generation, isn’t a terribly huge area considering the duration of 50 years and still going.
https://explore.openelectricity.org.au/facility/au/NEM/GSTONE/?range=3d&interval=30m
Of course the best output vs small land impact is nuclear with it’s immense energy density.
110
I’ve seen a flyover type video presentation of wind and solar installations for Victoria and NSW. They have been produced, so to say they don’t exist is probably not completely accurate. The one I saw was probably done by a Victorian government body- because they’re so proud of their achievements in uglifying the state’s landscape. Plus there’s the following website which has nearly 1400 drone videos of Australian wind and solar projects. https://www.shutterstock.com/video/search/australia-wind-farm
110
Thanks for the link
A flyover of existing ruinables reveals the current destruction of the environment, all in order to ‘save’ it, of course.
Maps showing the future ruination are what the green luvvies are not showing the general populace, nor the MSM
No doubt the future exorbitant cost of building the planned (plus not-yet-planned but inevitable) infrastructure is not in BOBowen’s wildly inaccurate ‘lowest cost’ of generation.
151
John, I wonder if there would be any Union involvement in the Building contracts……let’s add say another 30% to everything if they are …..and elongate the Build times x 4…….how much extra for us poor bludgers to pay ?????
141
Hi Ross, when I click on the link for the drone flyovers, it doesn’t work?
00
Poor Fellow My Country.
310
What to do with the great majority who never get to see these monstrosities in real life. So many people cocooned in their urban world who extol this striving for net zero and clean green. I tell you that we’re headed for peak stupidity.
160
Looking at that photograph at the top of the page shows a lot of Bird Choppers in a previously pristine location. How the bird life will survive in places like that beats me. Eagles and other birds of prey are just going to disappear over time as well as many other birds and bats.
Also, how on earth can Blackout Bowen and the many Agencies say that the map overstates the situation? They have nothing to compare it too as none of them have maps of their own. What a load of BS and well done those Volunteers.
470
Not just that. They’re finding that the infrasound can drive away bugs and worms. Soil structure is suffering, localised food chains are being disrupted. And at sea…
These things are a disaster at every level, and Greens support them. Greens are not Environmentalists any more, but Conservatives always have been.
360
I find wind subsidy farms sickening to look at. To me they represent anti-science and anti-Civilisation and the embodiment of the Left’s efforts to destroy Australia and all Western countries (except no longer the United States under TRUMP).
They regress us to a time before the Industrial Revolution and steam power when we had to rely on human or animal power or random offerings of the wind.
In the Thursday thread I also mentioned how the Lake Goldsmith Steam Rally site, essentially a celebration of the machines that made the Industrial Revolution is now surrounded by one of Australia’s largest wind subsidy farms. It makes me feel ill driving past it, it used to be a beautiful rural landscape. Even at the Steam Rally site you can’t avoid seeing these hideous monstrosities.
430
You see them, your body hears them and the sight lines destroy property values.
What more could you ask for?
And the government(s) do this for your own good. What next asbestos lined playgrounds or dioxin lakes?
280
I would like to see a comparison map showing the total area used by coal power stations and their associated mines, gas power stations and hydro power stations and the wind and solar subsidy-harvesting plantations and associated access roads and power lines.
It will be found that the area used by real power stations is minimal and the sites are most invisible as compared to the wind and solar plantations and associated areas which use massive areas of land and cause environmental destruction and are typically highly visible.
It would be good to develop some sort of “visibility index“.
220
Don’t forget that coal is often found in valleys, making the mine naturally invisible from just over the horizon, a windmill on the other hand is located to maximise it’s impact on the once pleasant scenery.
You couldn’t select a site more capable of damaging the scenery if you tried. Imagine asking your local council to put up a Trump*** sign that is in the same location and with the same range of visibility. (*** Change the wording as you like, the sign will not get approved.)
Why destroy for everyone, for the benefit of the few, (subsidy harvesters)? Especially when the ‘everyone’ doesn’t get a say.
320
Yes, the impact of wind plantations is far greater than even their direct land use because the can be seen and heard (via infrasound) for many kms.
170
I had this kept as a factoid from years ago. (maybe ex Robert Bryce?) Might be helpful as a comparison.
Coal power – 100-1000W/m2
Natural gas- 200-2000W/m2
Nuclear power – 500-1000W/m2
Hydro -5-50W/m2
Wind- 1-10 W/m2
Solar PV- 5-20W/m2
Biomass- 0.1-1W/m2.
Note how our really smart Victorian government is concentrating on the bottom 3. Also, when you think about it, hydro’s not that good either. Especially when you consider the damage to environment from building dams.
60
Do we need to include the area of the artificial lakes in the area of a hydro station?
They do provide some amenity/benefit in return for the flooded area.
20
All of them stranded assets as the inevitable high price of essential generation drive rooftop solar dramatic increase and heavy industry demise.
I have been reading through the submissions to the misinformation enquiry. Those who condemn the legislation give concrete examples like this one:
As a rural landowner and small farmer I, alongside hundreds of thousands of people in mainly regional communities, am fighting for the environment, the safety of my home and my neighbours homes, the ability to produce safe food, property rights and the value of my families largest investment, along with the survival of our previously peaceful and prosperous region.
The premise of this Inquiry appears to be that anyone pushing back against the energy transition is either the victim of, or a conduit of “misinformation or disinformation”.
This submission will address this misconception, while hopefully explaining some truths on the irreparable damage being done by the systems that are supposed to save us. The issues of unaffordable, unreliable energy; endangering the long-term safety and the stability of our food supply; along with dystopian landscapes of abandoned factories covered in tonnes of toxic waste for which there are no sustainable recycling plans are areas of concern for all Australians.
https://www.aph.gov.au/DocumentStore.ashx?id=50ca3e5a-2cb1-48a7-b024-603a40f9f013&subId=777873
It is mainly out of touch academics who support the misinformation legislation:
At a political level, there could be a reform of laws in respect of political lobbying. This submission argues that truth in political advertising laws could address the problem of astroturfing. Likewise, legislation on misinformation and disinformation could cover the problem of astroturfing within its remit. Astroturfing by foreign governments could raise larger issues in respect of foreign interference.
https://www.aph.gov.au/DocumentStore.ashx?id=a14178ff-1ab6-4b90-810a-88543993847a&subId=778227
However not all academics support the legislation.
It will be interesting to see what this enquiry achieves. Maybe there will be a few exploding green heads. Real environmentalists would be dead set against destruction of the environment the NetZero fantasy demands.
350
Just amazing that most Aussies haven’t got a clue about the toxic, unreliable mess that Labor, Greens and Teals are creating for our future and this toxic mess has to be replaced every 15 to 20 years.
We must build only cheap, reliable BASELOAD energy for our future and insist that we need reliable energy to last until 2100 and not RUINABLE s replaced by 2045 and again and again and again before 2100.
170
Never forget that the Renew Economy site also tells us that Australia will need 100 times more energy than we generate today.
So how many TRILLIONs of $ must we waste on these toxic, unreliable W & S ruinables before Albo and B O Bowen + Greens, Teals etc start to wake up?
210
Again here’s the Renew Economy quote about Australian energy requirements by 2030, or from 30 gigawatts to 3000 gigawatts in just 5 more years?
Does anyone really think this is possible or desirable and will it cost more than 9 TRILLION $?
Here’s their quote…..
“Australia will need nearly three terrawatts, or 3,000 gigawatts, of wind and solar if it is to meet its goal of a net zero economy by 2030, a plan that could cost up to $9 trillion, according to a new study”.
“The astonishing numbers are revealed in a new report – Net Zero Australia – put together by Melbourne University, the University of Queensland, and the Nous Group, and released on Wednesday”.
“To put the 3,000 gigawatts of wind and solar in some context, Australia currently only has about 30GW of large scale wind and solar across the country. So it has a lot to do”.
120
It’s probably a typo. They meant to say 3,000 TWhours, and just left off the hours.. Giles Parkinson is just a journalist, not an engineer.
Currently we generate a bit less than 300TWh a year in Australia. So this would be a ten times increase. But 3,000TW of generation is ridiculous, even for the wildest renewable wish fairy. Shame Giles took a typo, put it in the headline and compared it to generation in GW meaning it wasn’t just a typo, but a complete misunderstanding.
Figure 23 on Reneweconomy’s article shows total generation “domestically” = 500GWh. The dark blue is this imaginary industry called “Energy Exports”. That’s where most of the 3,000TWh is anyway — and up to 10,000 TWh!. Dreamland.
Page 41 of their latest report says “$9t by 2050″ on page 41.
https://www.netzeroaustralia.net.au/wp-content/uploads/2025/09/NZAu-Topical-Report-1-Net-Zero-Pathways-24-Sep-2025.pdf
But I could probably ask an AI to make up an equivalent 50 page color report in five minutes that had as much credibility. I want to know where the money came from for this tripe.
120
And it shows.
That’s why they keep electing Green/Labor governments.
The fake conservative Liberals are bad but still slightly less bad than Green/Labor.
Present company excepted, Aussie voters are mostly the product of the dumbed-down “education” system which was infiltrated by the Left starting in about 1970.
And it will get FAR worse when the social media ban is enforced for children. They will have no access to alternative points of view or discussions whatsoever.
220
Jo,
A nitpick:
Lap around the equator is 40,000 km. You may have been thinking of miles.
28,000 km would comfortably do a lap at London’s latitude (say).
60
Second nitpick: Heading needs to end in “to…”, not “too…”
40
The 28,000km line was a quote from the Rainforest Reserves press release. I was just cut and pasting. They may have been thinking of miles… I’ll let them know.
Fair point about the “too”. Fixed. My fingers like typing “too” on some kind of autopilot.
100
Another interesting factoid is that at the equator 8,714 km of land is over the equator while 31,361 km is over the sea (40,075 km total).
70
So which great circle has the highest land percentage?
Let me know if you can solve that with just a globe.
AI is excluded, it’ll probably lie anyway.
60
Just dusted off my globe and examined the obvious path starting in Antarctica and going through South and North America exiting at Alaska and then going through Asia and India back to Antarctica. A rough estimate is between two thirds and three quarters land.
00
They can build all that but they can’t build a few tens of thousands of new homes for people to live in.
220
Hi Jo
Here’s a map that OpenNEM have been updating for years.
https://explore.openelectricity.org.au/facilities/nem/?status=operating
Best wishes
Ken
60
Like the way they hide their actual visible footprint. The dot sizes are according to generation output.
80
It is not close to complete.
Two wind farms near me – Lake Victoria Wind Farm and Gol Gol Wind farm are not on the list. They are both in the planning stage. We are hopeful that they will fade away. The company running the Lake Victoria one is making out like it is supported by the community when it is not. It is also going to cover 45,891 ha (458 square km). Heaven help us.
I wonder if that is by design or because the information is not readily available.
60
The link did say status=operating
20
The old saying “you get what you pay for” comes to mind here.
It is true that wind energy is cheap. It is also true it is useless and Australia is well on the way to finding that out. Plastering these ugly bird killers across the country side is doing real harm to the environment. It cheapens the landscape. They have the potential to turn farmland into deserts by reducing moisture advection from the oceans.
They are not “renewable”. They are already a stranded asset. When the subsidies end in 2030 for the first crop, they will be gradually shut down because they will all be uneconomic and not replaced.
Yesterday afternoon South Australian rooftops were producing 1408MW. Grid solar 0MW with 428MW curtailed. Wind was producing 285MW with 759MW curtailed. Grid solar in SA is now curtailed more than it generates. Curtailment of wind is increasing as each new rooftop and household battery gets powered up. Australians are transitioning to rooftop solar power and no heavy industry.
190
Good. Fast. Cheap. Pick any two.
110
140
More proof that the entire world has been scammed by false advertising from governments labelling wind generators “renewable”. None of those wind turbines are renewing themselves. In fact, they will be fatigued structures awaiting collapse. And clearly they are not even replaceable.
This is clear proof of misleading advertising and something I will lodge with Consumer Affairs
90
RickWill, I don’t call 9 trillion $ cheap energy. Just read the first 4 paragraphs at the R E link and we’re now expected to meet that cost by 2030.
Yet their ABC and CSIRO tell us that a large Nuclear stn would cost 8.5 billion $.
Just divide that 8.5 times 7 billion or 56 billion $ into 9 trillion and we also keep our pristine environments.
https://reneweconomy.com.au/net-zero-study-finds-australia-needs-nearly-three-terawatts-of-wind-and-solar/
130
Reneweconomy tries it’s best to present a nice picture but those with a brain see the flaws in its announcements. They still crow about the number of homes a new project will support but never mention that it will only do so for maybe 24% of the time. It then leaves out where the other 76% of the power will come from. Lies by omission are just as dangerous and misleading as lies of commission. Will the mis-dis laws stop false advertising by the renewable industry?
70
In SA more than half the homes supply themselves. So the idea of grid scale wind or solar supplying homes is a fallacy. There is an ever reducing number of homes to supply.
The homes only want essential generation when their batteries are flat. There is no guarantee the wind will be blowing when the battery is flat.
40
It is cheap if you only want energy when the wind blows. It gets horribly expensive if you want energy when the wind is not blowing.
And that is why CSIRO are so wrong and effectively lying to everyone.
That is why wind is so useless. It can go missing for an entire month so the associated storage requirement is massive. There is some sunshine every day in Australia. And you can count on having 2 hours of full sunshine in 48 hours in most parts of mainland Australia with 99.9% certainty.
20
2 hours of full sunshine in 48 hours in most parts of mainland Australia with 99.9% certainty.
Perhaps why I would like to see the BOM sites include insolation values along with the temperature and precipitation amounts.
And southern WA does seem to have VERY cloudy winters…..
00
90
Denis,
AT THE RIGHT TIME WHEN IT IS NEEDED There! fixed it.
41
Hard to see what needed “fixing”
20
Tragic 6 min video about the devastating consequences of wind subsidy plantations.
https://youtu.be/zr3z_7iQ35s
60
I think it’s fair to say that anyone who supports wind plantations must HATE the environment or alternatively has never left their woke inner city vegan soy latte enclave to see them “in the wild”, or both, or most likely, they simply don’t care.
200
Waste – The Biggest Myth Of Nuclear Power
https://www.nuclearasia.com/feature/millions-of-tons-of-nuclear-waste-the-biggest-myth-of-nuclear-power/3939/
41
(Video.) Now Wong (Australian far Left Foreign Minister) is disagreeing with President TRUMP’s factual statement that climate change is a con job.
Hasn’t she noticed that the US economy is starting to boom, partly attributed to TRUMP dropping the anti-energy policies of his predecessors?
Meanwhile Australia is prepared to destroy its economy and standard of living to prove how woke it is and its fanatical commitment to the con job, when even other woke nations are extricating itself from it.
https://youtu.be/XcnQUH4UBFM (49 sec)
201
The economy isn’t her job. She has to focus on cocktail parties and virtue signallimg.
70
However will that 7,800klm’s of undersea cabling make it through all the “song lines” ???????
121
Just apply more $s
50
You alter the song lines to 50 cycle AC and then they contribute power?
40
Offshore wind power is not popular.
https://stopthesethings.com/2025/10/05/stop-these-things-weekly-round-up-5-october-2025/
31
There is a simple reason why any of our billion dollar alphabet agencies haven’t put out a map, we are being given the mushroom treatment.
100
Plus are Lamestream Media and the fake conservative Liberal “opposition” don’t ask questions.
70
By Order of the vested interests controlling both sides of the two party preferred statistics and Teals
50
FWIW
Earlier today while driving I was listening to the Bill MacDonald show broadcast by the Resonate Broadcasting chain.
They had Steve on for an interesting interview. And they have put links to his map up on their PR channel, so ought to widen the exposure.
30
That is 4BC Brisbane and rebroadcast by Resonate over their rural Qld network
20
Economist and energy expert Leith Van Onselen talks here about W and S + batteries etc and the mess Aussies will be in if we don’t stop this net zero madness within 5 years.
He’s a regular on Sky News and during this talk he called Albo and Bowen etc zealots and lunatics.
This is about 20 minutes, but he covers a lot of ground.
https://www.youtube.com/watch?v=EzqpMKJfIXI
80
He is a Top Man. I watch him a lot on ‘You Choob’.
40
I was banned from Macrobusiness more than a decade ago for calling out the climate scam and the “renewables” folly.
Now this sick individual sees the light but I will never get an apology.
80
The grid transition solved.
12 million homes fitted with the Aldi 6.6kW/20kWh package. That gets 79GW of solar and 240GWh of battery for only $1tr plus other government incentives.
Businesses are clearly irrelevant because they never get counted in the “houses supplied” with all the “renewables” projects. No land acquisition issues. No new transmission lines. Keep a couple of the coal plants fired up to help the solar panels through winter. A few rules around rights to sunlight for council guidelines and all solved. Thank you Aldi.
I was looking at a Google Map image of Adelaide and there is still a lot of spare roof space. Probably less than 20% of available roof space with solar panels. So every prospect of rooftop solar easily supplying SA once all the industry has gone. Even with the current meagre amount, the rooftops are able to meet the 11am to 2pm demand quite often at this time of year.
I note that the $600m bailout of the Glencore Copper smelter is nothing more then a one year reprieve from the inevitable closure.
You have to wonder how flogging dead horses makes the economy work. Surely every job in a worthless industry is a worthless job. Apart from a few jobs in mining for export, all industry jobs in Australia are now worthless courtesy of the energy transition..
All those “renewable” energy engineering graduates are moving into dead end jobs. Complete waste of talent.
100
Hi Rick,
I see you’ve dropped down from your 2017 submission’s quote of 250 GW installed capacity of Rooftop solar plus 750 GWh of batteries.
Have you since realised that there is a need to keep a modicum of Synchronous Inertia at hand to try to keep the grid stable?
(Perhaps what happened in Spain and Portugal on 28 April last has given you pause to consider?)
At that level, 79 GW of rooftop installed capacity, your 240 GWh of battery storage capacity is way too low. I suggest that it will take rather more than “a couple of coal plants” to keep the grid both supplied and stable through the winters. I presume you meant to add the sarcastic tag there.
Furthermore, I really do worry about the fire risk of all those home batteries.
Bowen would have no motivation whatsoever to put in strict regulations on the siting of these batteries in homes.
Thanks Jo for highlighting this wonderful work of Steven and friends of the Rainforest Reserves folk.
Regards,
Paul Miskelly
60
FWIW – elsewhere
“Green Energy’s High Price: Wind Farms Are Ravaging Nature, Biodiversity”
https://wattsupwiththat.com/2025/10/08/green-energys-high-price-wind-farms-are-ravaging-nature-biodiversity/
20
FWIW – in things that the SCOTUS could do –
“Louisiana v. Callais: The Case That Could Finally Desegregate American Politics”
https://amuseonx.substack.com/p/louisiana-v-callais-the-case-that
Via https://instapundit.com/749627/#disqus_thread
10
FWIW – if you are “bubble watching”
“‘I Know Its Gonna Blow!’ ”
“Seriously folks, the OpenAI “investment” into AMD is arguably the most-ridiculous example of this I’ve ever seen.”
More at
https://market-ticker.org/akcs-www?post=254178
10
Unfortunately the app is too slow, riddled with bugs and doesn’t have the basics like tabular lists with all info. EG All existing and future windfarms with number of turbines, their nameplate capacity, capacity factor, concrete in base, installed cost, grants given, etc.
It would have been better to start with the basics and gradually expand complexity and functionality.
00