By Jo Nova
Warn the bankers, our climate models are not something to invest in say the modelers
A group of top climate modelers have come together to warn bankers that climate models are wonderful but basically useless for predicting things that financial models need — like the trends in the hottest, wettest or windiest weather in any city on Earth. Often the expert models can’t even agree on the sign. Will it get bigger or smaller? It’s that bad.
The raw truth of just how unskilled these models are is laid bare in the graphs. The modeling team chose London, Mumbai, New York and Beijing and picked the nearest 100km x 100km “square” on the map. They ran about 37 models on 3 scenarios and achieved something that looks like a painting done with a jet engine.
The modelers can’t say if the hottest maximums in Beijing will get hotter. Even if the world warms 2 degrees (by random happenstance), Beijing’s hottest-days might actually get cooler. The rainiest days of the year could be more extreme unless they’re less extreme. And the windiest days will definitely be stronger, weaker, or about the same. Get it?
The quote of the century is from Professor Andy Pitman to Graham Lloyd:
Lead author Andy Pitman, director of the ARC Centre of Excellence for Climate System Science, told The Weekend Australian: “Climate models are very valuable tools for many applications but they are not something I want used to decide investment strategies for my superannuation.”
— The Australian, Climate models ‘a global bank risk’
So climate models are not good enough for his superannuation but it’s fine to bet the national economy on? Should we transform our entire energy network, change our vehicles, our crops, and eat crickets for breakfast? Why not. More to the point, all around the world people are blaming individual floods and storms on “Climate Change” but modelers know that isn’t true, and they are staying very quiet. While people are selling homes, farmers are planting different orchards, and councils are thinking about sea-walls, the truth is that we don’t even know if heavy rain will increase or decrease in any one location. Wind farm owners (and the hostage public) are building wind farms in places that may not get windier. The list of potential economic damage is vast. Why do only the bankers matter? (Because they can afford lawyers..?)
And why is every two-bit attention seeking celebrity mayor or high school drop-out promoted on TV to say things that are patently scientific voodoo while our billion dollar national institutions sit mute?
“We show that GMT [Global Mean Temperature] provides little insight on how acute risks likely material to the financial sector (‘material extremes’) will change at a city-scale.”
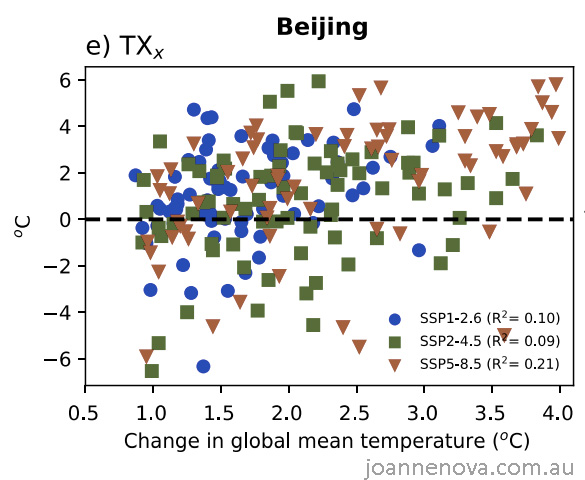
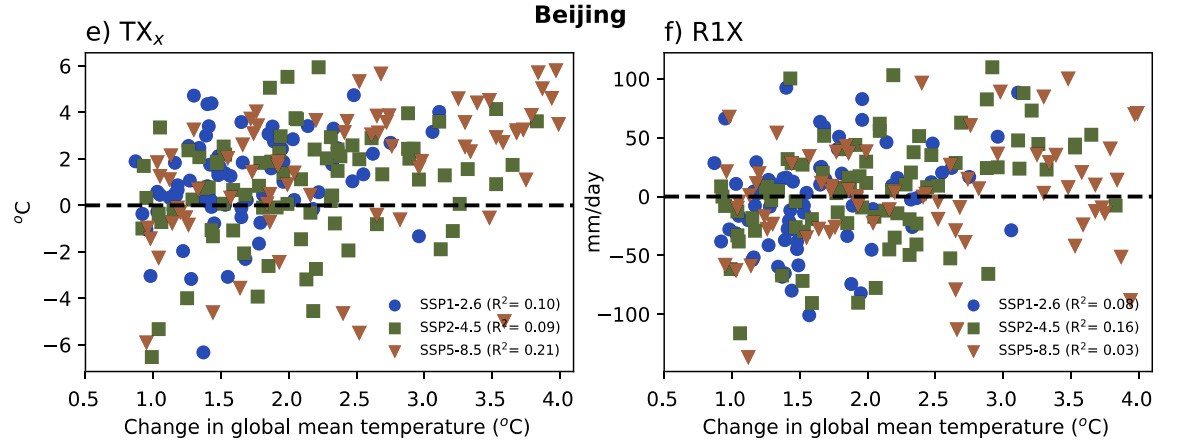
Modeled change in temperature of the hottest day of the year in Beijing (the index TXx )
We get an idea of the uncertainty involved. Note the zero line runs through the middle. That’s a range of plus or minus 6 degrees Celsius for every scenario up to 3 degrees warmer.
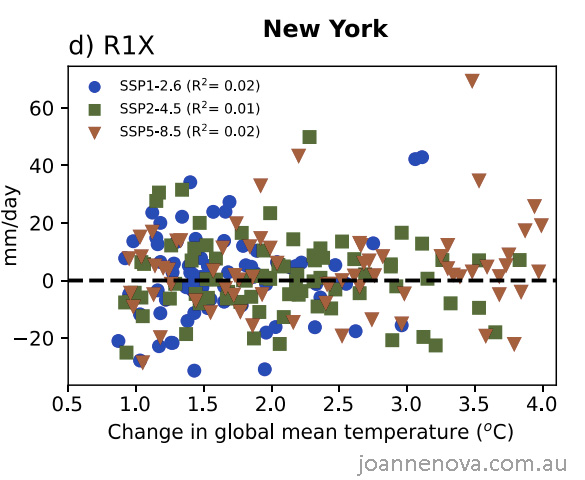
And this below is the change in the amount of rainfall occurring on New York’s wettest day of the year ( R1X)
The wettest day might be 25mm less, or 35mm more, or about the same. And it’s even true in a world three degrees warmer. (Well, true in the models).
 It’s true to say that one of the models will be right, we just don’t know which one.
Like there will always be one guy who is brilliant at tossing coins, but no one knows who he was til after the game.
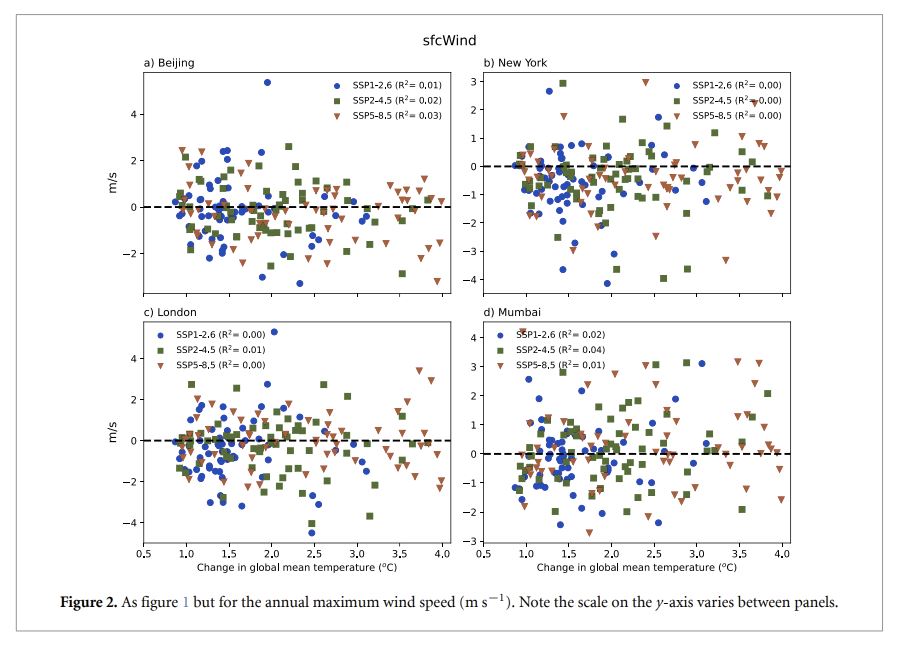
And the models are skill-less with wind as well
This is 37 models, 3 scenarios and millions of lines of code. Imagine starting with this kind of scattergun uncertainty and then multiplying it by the unknowns in economic model forecasts for the next fifty years. We’d get the perfect cloud. Call it a fog.
Click to enlarge, not that it matters whether you look up close or far away…
Click to enlarge
It’s presented as an eclectic modeling issue of importance to financiers, but the raw truth is that it rather blows away the idea that the hottest, wettest or windiest days now or in the next fifty years can be blamed on “climate change”.
Are there two kinds of science?
Professor Pitman said attempts to use dynamical downscaling to get far higher resolution data was “excellent science but not science designed for the financial sector”.
The laws of science used to be universal, now we need a new science to help people make money. Excellent science must be good for propaganda campaigns, but people who want to make money need the other kind of science — the one that works.
We lost that somewhere.
No wonder the climate modelers are nervous about the financial risk
Admire the detail. Here are the trends in hottest and wettest days in four hand-picked cities with a combined population of about 70 million people. Remember these graphs every time you hear about the hottest ever day or the worst flood, or that a “rain bomb” was caused by climate change.
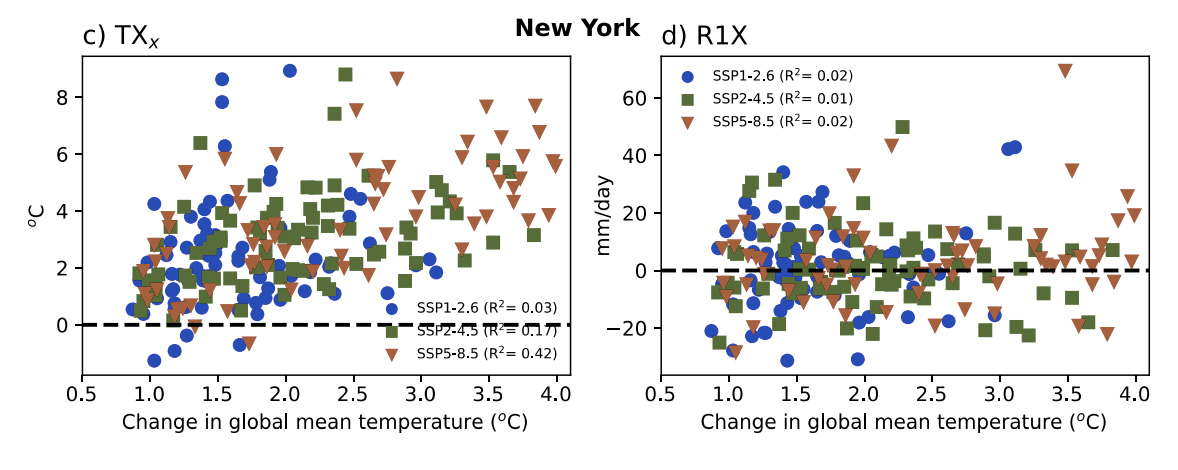
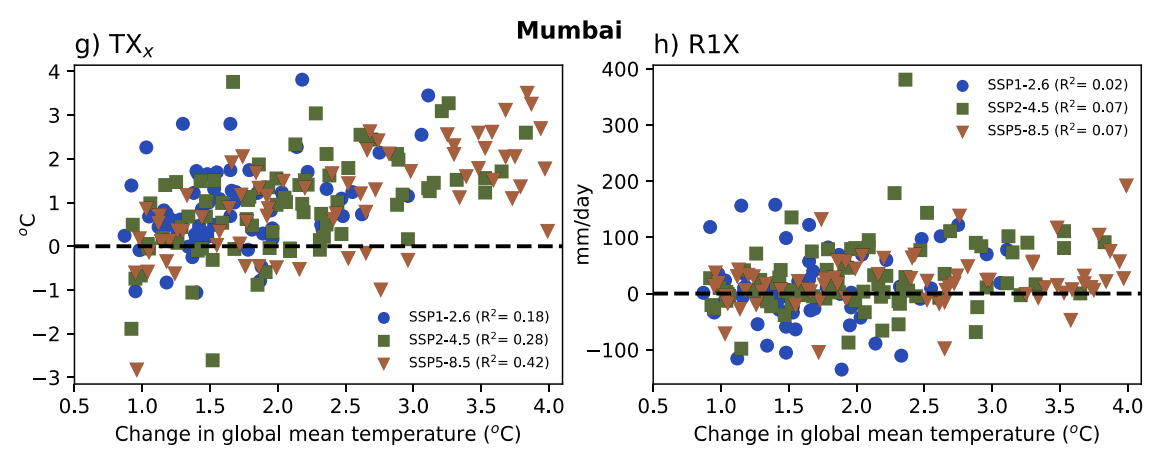
The paper drily notes no link, and no statistical significance (These eight graphs above are all “Figure 1”)
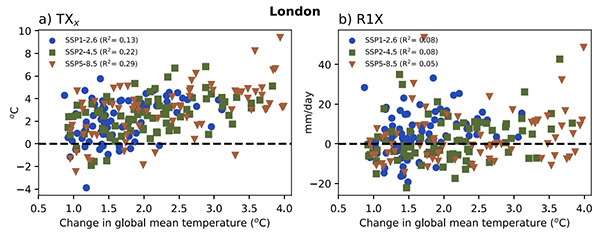
…Figure 1 demonstrates no strong link between GMT [Global Mean Temperature] and the amount of rainfall on the wettest day of the year (RX1). For London, the largest increases occur under the lowest emission scenario, and none of the regression lines are statistically significant (the highest R2 value is only 0.08). Results are very similar for the other cities. Note, for each city, increases in GMT can be associated with decreases in RX1 for many of the models, and the sign of the change does not become clear for any emission scenario until GMT exceeds 2 ◦C.
Gone is the guarantee that a higher Global Mean Temperature means a hotter, wetter and winder city.
Curiously one of the new risks to worry about is called a compound event. It involves odd combinations of weather which are not extreme just extremely-expensive:
However, material extremes could also include events that are not ‘extreme’ in a statistical sense, especially if they occur concurrently as compound events (Zscheischler et al 2018, Ranger et al 2021). One example is the possible shift in climate towards long periods of low wind and cloudy conditions—a material extreme to a renewable energy provider and a potential risk to a national economy via disrupted energy supply, a problem that has already occurred in Europe (Bloomfield 2021)
Wouldn’t it be good if modelers could have warned us about how climate change causes low wind and cloudy conditions before people built energy systems based on wind and solar power?
Wouldn’t it be good if modelers could predict the climate. Most of the hottest and wettest days have something to do with large oceanic cycles that we can’t predict more than a few months in advance.
Even the modelers say the models are for telling stories, not for making predictions:
They just don’t say it so simply:
Using climate models to inform scenarios, storylines (Shepherd 2019, Jack et al 2020) and stress testing, or using climate models to modify the statistics represented in current-day catastrophe modelling can all help break the false assumption that the numerical precision in climate models equates to accuracy at a granular level. In many ways, this echoes guidance from Schinko et al (2017) to consider models as tools to explore a system as distinct from predicting a system, or Saravanan (2022) who explores the need to take climate models seriously, but not literally.
What’s the difference between serious and literal? Should we salute the modelers but not spend billions of dollars on their storylines?
REFERENCE
Pitman, A et al (2022) Acute climate risks in the financial system: examining the utility of climate model projections, Environ. Res.: Climate 1 025002
CAPTION Figure 1: (The TX and R1X scatter graphs).
Figure 1. Change in TXx (left column, oC) and RX1 (right column, mm d−1) as a function of the change in the global mean temperature for three emission scenarios from CMIP6 model simulations (low/SSP1-2.6: blue circles; medium/SSP2-4.5: green squares; high/SSP5-8.5: red triangles). The change in the global mean temperature is calculated for each 20 year period from 2000 to 2100 for each model using the mean over 1961–1990 as baseline. The change in TXx is then calculated for the same 20 year period for a grid point coincident with each city. Since 20 year time periods are used, there are four data points for each model. Note that the scale on the y-axis varies between panels.
TXx (index) is the temperature of the hottest day of the year (annual maximum temperature)
R1X is the amount of rainfall occurring on the wettest day of the year (annual maximum precipitation sum).