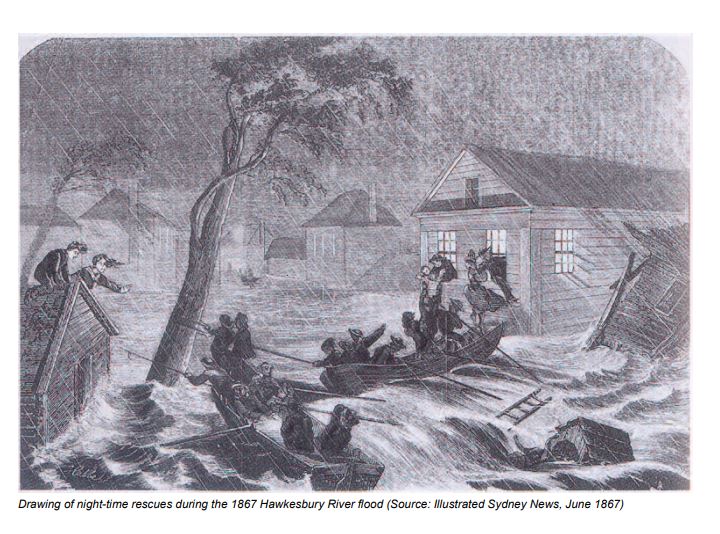
The bad news for Sydney-siders is that floods have been happening to them for all of history and probably a lot of prehistory too, though the ABC and BOM don’t mention it. This week the flooding in Windsor appears to have peaked at almost 14 metres. But in 1867 the water peaked at 63 feet or an amazing 19 metres.
Not to dismiss any of the suffering of the current flooding in Sydney, because I’m sure it’s horrible. Just people need to know the Bureau of Met isn’t telling them the whole truth, and climate grifters are exploiting their pain so they can nab a few more grants, or sell some solar panels.
The Guardian laments that For Hawkesbury residents flooding is now a part of life and blames climate change. But nothing has changed since 200 years ago. For the first thirty years of European settlement, floods hit the Hawkesbury river one after the other, people died, and houses were washed away. Back then, people were in danger of starving when the crops failed. Flooding would have been a very big deal.
A little book called The Early Days of Windsor, by James Steele was published long ago in 1916. It tells us that early flooding for the first European settlers in Australia was frequent, and was so bad on the Hawksbury in 1798 the Governor even limited the sale of rum (it must have been serious). The first Government House in Windsor was said to be “swept away” in 1799. This was followed by another flood in 1801 and a much worse one in 1806 when seven people died. The plucky residents only had to wait three years to be besieged again in 1809. By then people were getting so fed up of being flooded they moved Windsor and other settlements to higher ground in 1810, which was a jolly good thing because it flooded again in 1811.
In 1817 things were so bad, it was reported that the Hawkesbury and Nepean rivers had inundated the buildings on the banks “three times within nine months”.
After that, everything dried out for a few decades. Droughts struck across Australia instead. That was until the late 1850s when flooding came back into fashion, climatically speaking. Symbolising this shift, a neat little church at Clydesdale was built in 1842 and lasted til the great flood of 1867 when things got so bad there was “driftwood on the roof”. The book drily notes: “This church is now closed.” By 1872, flooding was again so common the people of Windsor even formed “a water brigade” so they were ready to rescue people and knew how the manage the flood boats. It sounds a bit like an early inland version of the Royal Life Saving Society that wouldn’t even start work on Australian beaches for another twenty years.
The whole book is available online, and even though Australia was almost NetZero when it was published a hundred years ago, it already had 67 mentions of the word flood.
NSW Government 1867 Pdf.
Early days of Windsor by James Steele Hawkesbury
On account of distress caused by floods the Governor curtailed the sale of rum during the year 1798.
For the first twenty-five or thirty years of the settlement of New South Wales, the Hawkesbury was looked upon as the granary of the colony. When floods came the greatest anxiety was caused in Sydney and Parramatta, and floods were fairly frequent in those days…
There was another Government House earlier still, erected at the time of the first settlement in the district. This was reported to have been swept away by flood waters in 1799.
On 23rd March, 1806, there was a great flood in the Hawkesbury, which rose ten feet higher than the flood of 1801 and reached to within eighteen inches of Dr. Am dell’s home at “Catty”. The Governor appointed a commission, consisting of Dr. Arndell, Rev. S. Marsden, and Mr. N. Bailey, to visit and report concerning the damage done by this flood, and afford relief where necessary. They reported the loss of wheat, maize, barley, live stock, and buildings valued at £35,248, in addition to the loss of seven lives.
Extract from Government and General Order, dated 15th December, 1810:—
“The frequent inundations of the rivers Hawkesbury and Nepean having been hitherto attended with the most calamitous effects, with regard to crops growing in their vicinity, and in consequence of most serious injury to the necessary subsistence of the colony, the Governor has deemed it expedient (in order to guard as far as human foresight can extend against the recurrence of such calamities), to erect certain townships in the most contiguous and eligible high grounds in the several districts subjected to those inundations for the purpose of rendering every possible accommodation and security to the settlers whose farms are exposed to the floods.
Back then when floods destroyed crops, people starved, but charities saved the day:
“The rivers Hawkesbury and Nepean, having inundated the various settlements on their banks three times within nine months, and swept away great quantities of wheat and stock of all kinds, as well as totally destroying the growing crop of maize, which was nearly ripe, a most lamentable scarcity of grain prevailed, and hundreds in the districts of the Hawkesbury were reduced to a state of starvation: and to alleviate these distresses the Magistrates and other gentlemen at Windsor and the surrounding districts raised the sum of five hundred pounds by voluntary subscription, on the 28th June, 1817, which was lain out in the purchase of provisions, chiefly rice, and issued weekly to upwards of five hundred distressed persons, by Mr. Harpur, at the Public Schoolhouse at Windsor, until the harvest commenced, November 23rd, 1817.”
From Mr Tebbuts Observatory notes:
Highest Floods at Windsor.
We give herewith a list of the biggest floods, that is, such as rose thirty-five feet or more. This would be at least fifteen feet over the present Windsor bridge, and would encroach a considerable way up Bridge, Baker, Kable, and Fitzgerald streets on the north side, whilst a forty-eight feet rise would bring the water right across George Street near New Street. Such rises occurred in the years 1864 and 1867. The highest flood recorded was that in 1867, June 23, which rose sixty-three feet. All Windsor was covered excepting two spots; an island about two hundred feet wide, and extending from Johnston Street, near the Gazette office, up to the School of Arts and a little beyond. Another island started near New Street, extending along the Terrace past St. Matthew’s Church, taking in Tebbutt Street and part of McQuade Park, and from the railway station about a mile back along the Penrith Road.
Richmond was half under water. An island was formed about the old Clarendon House to near the Roman Catholic Church. Another island started from about the Black Horse Hotel, and extended back through part of “Hobartville” to Yarramundi. Pitt Town was also an island two hundred chains long and the same wide. The whole of the road to Pitt Town and Cattai was under water, except a small portion in Pitt Town. The Parramatta road was under water out to Vineyard. Most of the Riverstone Meat Company’s paddocks were also flooded, and all the low laud away towards Blacktown.
The flood measurements in the accompanying list, from 1855 to date, are taken from the meteorological observations of Mr. J. Tebbutt, F.R.A.S., made at his private observatory on the Peninsula, near Windsor, and may, therefore, be accepted as correct. Those given before that date are, we fear, not so accurate, and at times are much exaggerated.
-
-
- 1799, March 3—Rose 50 feet. (15m) One life lost.
- 1800, March—Rose 40 feet. (12m)
- 1806, August 26—Rose 47 feet Five lives lost. Hundreds of haystacks floated away.
- 1809, August 1 —Rose 48 feet. Eight lives lost. In consequence of floods Windsor and other towns were laid out on higher ground in 1810.
- 1811, March 25.
- 1816, June 2—Rose 45 feet.
- 1817, February 26—Rose 46 feet. Two lives were lost. A large relief fund was raised.
- 1819, February 20—Rose 46 feet.
- 1857, August 22—Rose 37.7 feet. The first big flood for thirty-eight years. Penrith bridge swept away.
- 1860, April 29-30—Rose 37.4 feet. Cornwallis bridge swept away. November 19—Rose 36 feet. Three big floods this year.
- 1864, June 13—Rose 48 feet. July 16—Rose 36.1 feet 55.03 inches of rain this year.
- 1867, June 23—Rose 63.2 feet (19.3m) Six lives were lost. Record flood, fifteen feet above the highest known.
- 1869, May 9—Rose 36.8 feet.
- 1870, April 28—Rose 45 feet. May 13-14—Rose 35.5 feet. Record wet year, 62.51 inches of rain falling. Seven big rises in the river.
- 1871, May 2—Rose 36.9 feet.
- 1873, February 26-27—Rose 41.6 feet.
- 1875, June 7—Rose 38.9 feet.
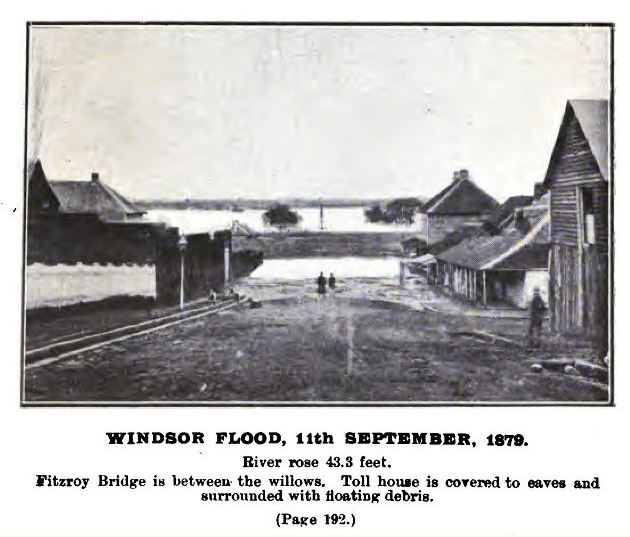
- 1879, September 11—Rose 43,3 feet.
- 1889, May 29—Rose 38.5 feet.
- 1890, March 13—Rose 38.9 feet. Three floods this year. 45.67 inches of rain fell.
- 1891, June 26—Rose 35.5 feet.
- 1900, July 7—Rose 46.2 feet.
- 1904, July 12—Rose 40.1 feet.
-
Conversions: 40 feet is 12.2 meters. 45 feet is 13.7m and 50 feet is 15.2 m. 63 feet is 19.3m.
————————————
1869 Floods — Source: Gutenberg ebooks
Snippets from flooding in the later half of the 1800s:
In the year 1842 a neat brick church was built at Clydesdale and named St. Phillip’s, the parish being from then known as “Windsor and Clydesdale”. Unfortunately, this church was built on the flood area, the big flood in 1867 leaving drift wood on the roof. This church is now closed.
…the Big Flood, 23rd June, 1867, when the river rose to the extraordinary height of sixty-three feet, and six lives were lost.
The Rev. H.T. Stiles died on the 22nd June, 1867, within two days of his sixtieth birthday. His death occurred while the big flood was at about its greatest height, the water having entered the Presbyterian Church in George Street, where large numbers of refugees had slept the previous night. The last duty performed by the dying minister was to order that the church doors of St. Matthew’s be opened in order to let the homeless people find a shelter from the rising flood.
A water brigade was formed in 1872, to be in readiness in case of flood, and to become proficient in the management of the flood boats. The members were Messrs. J. A. Dick, Wm. Moses, R.D.W. Walker, W. Gosper, W.F. Linsley, W. Alderson, and E.J. Tout.
THE danger from floods is always a source of anxiety to the occupants of the low-lying lands along the banks of the Hawkesbury; the river may rise and overflow its banks at any time during the whole year.
The tragic stories of families lost due to NSW floods is written up in Family Tree Circles.
See also History of the Floods of the Hawkesbury (J.P. Josephson), 1795-1881.


Comparing flood levels can be misleading because water flows are much more controlled now. Superficially, this weather system is a typical east coast low. What is different is the unusually warm ocean temperatures driven by La Nina and the overall warming trend.
670
Yes. Let’s talk about misleading people with lies that every flood today is “new” and “unusual” and caused by their air conditioner? “It’s Science”!
Let’s pretend the history of the early settlers doesn’t exist, their deaths and crop losses were not real and Australia doesn’t go through long cycles of floods and droughts and always has, and it has nothing to do with CO2.
Let’s talk about La Nina and how it causes all the floods but the BOM can’t predict the largest climate phenomenon on Earth because they don’t understand the climate.
What’s misleading is pretending the floods never happened before, and that “all flooding is climate change”.
1092
Individuals may say that a single event is due to climate change but meteorologists and climate scientists tend to be much more circumspect in the attribution and point to changing probabilities. This is an interesting article about the current system:
https://www.abc.net.au/news/2022-07-07/rossby-wave-jet-stream-triggers-floods/101192230
ENSO is notoriously difficult to forecast in advance, the BoM admit that a WATCH notice is only right 50% of the time and an ALERT has a 70% probability.
http://www.bom.gov.au/climate/enso/outlook/#tabs=About-ENSO-and-the-Outlook
444
Quoting their ABC and BOM, both leading contenders for ‘liar of the month’ doesn’t do your case much good.
682
The article is very instructive and its a blessed relief that BoM is finally coming to its senses.
“I think this is something that needs to get into the conversation with the Australian public,” she said.
“In Australia, Rossby waves are associated with heat waves, cold air outbreaks, heavy rainfall and drought.” And of course horrendous bushfire seasons.
94
Simon, The BOM and ABC and UNSW and ANU can’t hide behind the “individuals say it but we dont” excuse. They are happy to allow all and sundry to speak Scientific Gibberish as long as it suits the cause. Every time a Mayor or starlet, or “journalist” says “it’s a climate flood”, and the experts silently stand back — they defacto prostitute themselves for the renewables industry, or Big-Gov Grants or the Climate Religion.
Every time Prof Andy Pitman, or Matthew England or Will STeffan don’t speak up and correct the public mistakes of attribution, they are failing their duty to taxpayers.
Every time the ABC “forgets” to do their own research and find out that this isn’t the biggest flood, isn’t unusual, they are not doing their jobs. It only took one unpaid volunteer a few hours of hunting to find and collate these records. What do we pay $1b a year to the ABC to do? Hide history?
As for ENSO, it just shows the Big Lie — if they have no idea what drives ENSO (which even you admit) doesn’t that mean they cannot possibly predict the climate at any point in the future beyond a few months? If so, all their pronouncements of 98% certain doom are false prophesy. They are the grand charlatans pretending to know something they do not.
If it turns out that solar wind, solar magnetic effects, geothermal heating, UV spectral shifts or lunar orbits drive ENSO, then the Climate Models are all missing major forces and factors and are useless but sold as certainties and “expert”.
412
My gmail is malfunctioning [ again ] Joanne so can I ask why my comment in reply to Simons has disappeared ? I made the point that there is nothing misleading about comparing historical flood gauge levels and Simons arguments are actually misleading and superficial per se . Dams and reservoirs can mitigate floods and not all river systems and water flows are controlled which would suggest – and this is borne out by the stratigraphical data and historical records – the floods of the 19th century and the Little Ice Age were considerably worse than this centurys
I also cited the 2021 IPCC WG1 report which found that : ” In summary , there is low confidence in the human influence on the changes in high river flows on the global scale . Confidence is in general low in attributing changes in the probability or magnitude of flood events to human influence ” This is the same verdict as the 2013 IPCC WG1 report Did the Prime Minister Anthony Albanese , the Climate Council and the ABC get the memo ? Low confidence has no other interpretation or meaning apart from no convincing solid evidence for an anthropogenic climate change signal . Furthermore the hydrological expert Sharma et al examined the condundrum of rising precipitation falls vis a vis no perceptible worsening of floods and found that ” Despite evidence of increasing preciptation extremes corresponding evidence for increases in flooding remains elusive .If anything ,flood magnitudes are decreasing despite widespread claims by the climate community that if precipitation extremes floods must also ” Why is the Sharma et al research paper absent from the Climate Council’s and ABC’s coverage ?
Simons assertion ” What is different is the unusually warm ocean temperatures driven by La Nina and the overall warming trend ” is deception by omission .What I call ‘climate kitman ‘ The La Nina phenomenon is caused by the accretion of cooling seas in the eastern equatorial Pacific as the ‘atmosphere cools in response to the cold ocean surface ” Are we to presume the
‘overall warming trend ” is enhancing the cold waters in the eastern Pacific
or is it just warming the Tasman Sea ? https://earthobservatory.nasa.gov/world-of-change/ENSO
The warming seas off the eastern Australian coast bringing rains to Australia are the usual [ not unusual ] flipside of the La Nina phenomenon. Eastern Australian mainland temperatures this year are actually cooler with precocious heavy snowfalls as one expects with a La Nina pattern .
15 years ago the Bureau of Meteorology’s David Jones was quoted warning the Millennium Drought may be our ‘new normal ” while Tim Flannery – who in all seriousness compared himself to the Old Testament prophets – predicted even the rain that falls will never fill our dams and river systems. That voodoo science from the vault hasnt aged well . Now the sacred ‘science’ is telling us the floods of recent years were portentious of climate change and inevitable ? One sees this unfalsifiable ever changing eschatology in apocalyptic cults
[Stuart, I don’t know why any comment might have disappeared? Best pursue this at the bottom of the thread rather than at #1 though. – Jo]
40
but Ronin, the whole premise of the detailed history Simon is responding to is that the ABC and BOM have forgotten these floods.
515
Perhaps the context was that they had misrepresented severity on the basis of National Notional Flood Records and therefore deemed them irrelevant.
Everyone at those institutions Knows that CO2 did it.
130
But Gee, on Weds the ABC was claiming a key point about the cause of the flooding was ‘scientists say climate change is making the weather worse’. Doubtless one of many articles repeating the same misinformation.
https://www.abc.net.au/news/2022-07-06/why-is-it-flooding-again-in-new-south-wales/101210298
100
“… a WATCH notice is only right 50% of the time…” A 50% accuracy is nothing more than the odds of tossing a coin and guessing whether it will be heads or tails. It’s not science. If my predictions were right only 50% of the time, I’d admit I didn’t have a clue and completely review my predictive parameters.
170
” Individuals may say that a single event is due to climate change but meteorologists and climate scientists tend to be much more circumspect ”
That is another lie Simon .And a ‘false alternative’ fallacy. Climate scientists and meteorologists are individuals and I can cite a number of them who have irresponsibly and unprofessionally blamed ‘a single event’ on climate change .Did you pause to think at all before writing that nonsense ?
60
Watkin Tench came on the first fleet and only stayed about three years but reported of several Hawkesbury floods.
I have always wondered about the standout flood that was 3 metres higher than the second highest. Was it a case of a hugely greater quantity of water, or a blockage in the channel downstream?
I am not familiar with the channel but a blockage of 3 metres is not inconceivable. Three metres across the whole flood would take a huge quantity of rain.
60
I’m a descendant of James Ruse and his wife Elizabeth who were instrumental in setting up the farms in the region but were eventually forced out by the continual flooding. These pioneers really saved the colony from starvation despite this. Provisions were otherwise brought in by boat from Capetown involving a circumnavigation of the southern hemisphere.
100
Simon
In the UK we are fortunate to have actual records dating back to roman times which can be combined with studies of such things as flood walls or field systems. As this excellent article confirms floods have happeneded many times in the past in australia and the UK
Having read thousands of records myself many in the library at the UK met office there is no doubt that it has in the past few thousand Years been warmer than today and colder than today. It has been wetter than today and drier than today. It has been hotter and colder windier and calmer. Sea levels have been higher and lower.
The trouble is that so many people just don’t seem to concern themselves with history these days.as unfortunately that includes politicians, media and climate researchers they seem to have no idea that today’s events are rarely unique
730
The UN/IMF WEF Davos Government types know history and science perfectly well.
Climate Change has nothing to do with climate or science.
It’s social engineering.
Getting people to glue themselves to priceless art works is one of their proudest achievements.
Pro level game of ‘Simon Says’.
For the latest in ‘climate science’, I follow beach front real estate prices.
411
Correct. That is why they ignore both and push the agenda that everything is caused by CO2.
140
Exactly, when Hedges Av drops to $1 a block, I’ll believe.
10
What hasn’t changed is human nature.
Since the dawn of humanity priest, shamans and charlatans. Have pointed to extreme weather events, declared them a sign the Gods are angry and demanded sacrifices to their temple.
300
What overall warming trend Simon?
Please show me some non-fraudulent data demonstrating significant non-natural warming that’s not related to the emergence from the last glacial period.
340
http://berkeleyearth.lbl.gov/regions/Australia
331
They don’t state the source of that data. Where is it from?
It seems an implausible amount of warming.
260
http://berkeleyearth.org/about/
Berkley Earth is not improbable at all, it is consistent with HadCRUT4 and GISTEMP.
https://www.realclimate.org/index.php/archives/2022/01/another-dot-on-the-graph/
326
Simon, the data you show goes back to 1880.
But Australia has no official temperature record going back that far.
Why?
Because your comrades at the Bureau of Meterology simply deleted all data before 1910 because the data was inconsistent with the official narrative.
Remember, in woke “science”, if the data doesn’t fit the theory, it’s the data that’s wrong.
The data set you are presenting needs validation, as there is massive fraud with historical temperature records as Tony Heller has clearly demonstrated and as has Jo on this website.
In any case, even if there were warming, there has never been a time in human history when that has been a bad thing as clearly demonstrated during the flourishing of civilisation during the Minoan, Egyptian, Roman or Medieval Warm periods.
490
Yet strangely BERKLEY Earth, GISTEMO and HadCrut all use the same data and pretend to be independent, but none of them agree with the radiosondes like UAH does, and none of the agree with the majority of proxy studies going back 2000 years that show that nothing that is happening now is “unprecedented”.
And HadCrut, after all, uses just one sole thermometer on land in Indonesia, plus a few boat buckets dipped in the ocean to estimate half the world’s temperature in 1850.
For readers looking for those stories here. The INDEX (linked top right column) has many tags to find stories on BEST, HAdley, UAH. One of the largest tags is BOM Australia.
230
Jo has published here on fraud of Australia’s official temperature record many times but here’s a look at it by Jennifer Marohasy I quickly found.
https://climatechangethefacts.org.au/2022/02/25/australias-broken-temperature-record-part-2/
370
If you actually check the data, the majority of individual records on all the sites you mention have been heavily adjusted (and BoM is in that category as well.)
340
Methodology is here: https://static.berkeleyearth.org/papers/Methods-GIGS-1-103.pdf
Data and code is all independent, impartial and open source. Berkley Earth was set up by climate change skeptics initially funded by the Koch brothers. This is what they found. A true skepticism is prepared to change their mind when presented with additional information.
http://static.berkeleyearth.org/pdf/skeptics-guide-to-climate-change.pdf
415
Berkley is in California.
That’s USA.
Anything that is irrelevant will be found and deposited on this site.
101
Simon:
I would say there is about zero chance of uncorrupted data being allowed to be put on that site.
100
Berkeley Earth is junk.
1840s NZ is derived from Hobart Australia.
180
Should be:
[1850]s NZ is derived from Hobart Australia.
Junk Science
http://berkeleyearth.lbl.gov/regions/new-zealand
NZ actually has temperature records in the late 1800s e.g. Dunedin stations. Nothing like Berkeley Earth.
180
and the error distribution of ±0.94°C reflect that uncertainty. There is cross-correlation between Tasmania and NZ temperatures, which is unsurprising as both are often affected by the same weather systems.
311
Simon >”There is cross-correlation between Tasmania and NZ temperatures”
In your mind maybe but what correlation? How is that even performed i.e. with what datasets prior to 1909? NIWA discards anything prior to that date (7SS), Similarly BOM (ACORN).
BE derives 1850s NZ from Hobart specifically not “Tasmania” (I checked this with Steven Mosher):
BE Hobart
http://berkeleyearth.lbl.gov/locations/42.59S-148.36E
BE New Zealand
http://berkeleyearth.lbl.gov/regions/new-zealand
These regions only just coincide on the same graph (NZ high 11.2, Hobart low 11.2). The supposed correlation breaks down 1940 – 1960 too when ±0.15 uncertainty is supposedly much tighter than ±0.94 at 1850.
And, from data linked upthread,
NIWA has NZ 1950 at 12.2
BE has NZ 1950 at 10.3
That’s not a correlation of absolute temperature by any stretch. BE’s NZ series is bogus junk science.
90
BOM Hobart 1920 13.0
http://www.bom.gov.au/cgi-bin/climate/hqsites/site_data.cgi?variable=meanT&area=aus&station=094029&period=annual&dtype=raw&ave_yr=0
BE Hobart 1920 12.0
http://berkeleyearth.lbl.gov/locations/42.59S-148.36E
Pick a point on the BE graph at 1920/13.
One of these 2 series is a major outlier. Given the BOM series is unadjusted station data (094029) I think it’s safe to say Berkeley Earth is junk.
60
>”Given the BOM [Hobart] series is unadjusted station data (094029)”
Hobart
1920 13
2020 13.4
http://www.bom.gov.au/cgi-bin/climate/hqsites/site_data.cgi?variable=meanT&area=aus&station=094029&period=annual&dtype=raw&ave_yr=0
Demonstrates the effect of adjustments on homogenized series. There’s not a lot of difference at this station over 100 years of unadjusted data.
Set ‘Years of running average’ to 5.
Cooling from 1920 to 1955. And it wasn’t until after 2000 that the running average stays above 13.
80% of the series at about 13 or less.
20% of the series above 13.
60
>”80% of the series at about 13 or less.
20% of the series above 13.”
Setting to Anomaly (not Mean) and leaving in the 5 yr running average shows that 0 anomaly is about 13 absolute.
Confirms that except for 2 years, the anomaly only stays above 0 (13 absolute) after 2000. And 2000 is about the same as 1920.
The only change over those 80 years was a cool period between 1920 and 1975.
40
>”1840s NZ is derived from Hobart Australia.”
>”Should be: [1850]s NZ is derived from Hobart Australia.”
Right and wrong. The BE NZ graph begins 1953 using NZ stations but BE pulled in Hobart 1941-1953:
History of BEST NZ temperature stations
http://berkeleyearth.lbl.gov/auto/Regional/TAVG/Figures/new-zealand-TAVG-Counts.png
Steven Mosher email:
I tried and tried but never did get Mosher to specify the Hobart station with an ID#. My response was:
Given the BE – BOM – NIWA discrepancies documented upthread, particularly in regard to the raw unadjusted station data (eg Hobart 094029), it is apparent that the BE kriging method goes wildly astray from the original raw data.
Mosher again:
So the raw data is regressed, modelled, residualed, and interpolated.
As raw unadjusted BOM Hobart 094029 vs regressed, modelled, residualed, and interpolated BE Hobart demonstrates – raw data is best left raw.
60
Me >”…the BE kriging method goes wildly astray from the original raw data”
Mosher >”…a 2d surface of residuals. That field is then interpolated”
My point here is that BEs kriged 2D surface should be constrained by the initial raw datapoints because they are fixed (input and output should be the same at each initial raw datapoint), but obviously that is not the case for Hobart 094029 above (Ruakura/Hamilton/Waikato NZ is similar).
In other words, the raw input temperature should equal the 2D BEST output at each input station site.
Because, simply, the raw measured temperature at the input station site is the actual temperature. Creating a 2D surface by interpolating between fixed constraints is fine in principle but that is not what Berkeley Earth is doing as evidenced by their input vs output at input sites.
20
NIWA has a similar product for NZ to BEST (so does BOM for OZ – see below) but the input data is fixed and interpolation is between fixed input sites:
Note that BEST and VCSN are more rightly termed “virtual” rather than “actual” (although in NIWA’s VCSN the input data stays actual in output apart from minor smoothing).
20
For the record, many of the above issues have been brought up long ago. For example at Judith Curry’s Climate Etc: 1,178 RESPONSES TO “BERKELEY EARTH: RAW VERSUS ADJUSTED TEMPERATURE DATA”
Paul Homewood’s post on New Zealand, in particular the GISS vs BEST comparison of Gisborne Aero adjustments
https://judithcurry.com/2015/02/09/berkeley-earth-raw-versus-adjusted-temperature-data/#comment-673008
Different adjustments to the same raw data don’t match around New Zealand and Australia i.e. NIWA vs GISS vs BEST (NZ) and BOM vs GISS vs BEST (AU).
Comparison of methodologies e.g. Auckland NZ, NIWA vs NZCSC vs BEST vs GISS
https://judithcurry.com/2015/02/09/berkeley-earth-raw-versus-adjusted-temperature-data/#comment-673035
BEST botching Hamilton in the Waikato province NZ.
https://judithcurry.com/2015/02/09/berkeley-earth-raw-versus-adjusted-temperature-data/#comment-673293
PUERTO CASADO Uruguay – GISS/GHCN vs BEST adjustments
https://judithcurry.com/2015/02/09/berkeley-earth-raw-versus-adjusted-temperature-data/#comment-673472
That was over 7 years ago now.
30
The ‘dot on the graph’ graph has (apparently) benign temperature anomalies between 1880 and 1920, decades before we bagan to add copious amounts of CO2 to the atmosphere and temperatures (in that analysis) began to rise.
How do you reconcile these conditions with:
1889, May 29—Rose 38.5 feet.
1890, March 13—Rose 38.9 feet. Three floods this year. 45.67 inches of rain fell.
1891, June 26—Rose 35.5 feet.
1900, July 7—Rose 46.2 feet.
1904, July 12—Rose 40.1 feet.
90
Simon >”Berkley Earth is not improbable at all, it is consistent with HadCRUT4 and GISTEMP”
This is laugh out loud laughable (LOL).
BE has NZ at 10.01 – 10.25 1913
http://berkeleyearth.lbl.gov/regions/new-zealand
NIWA NZ 7SS at 11.57 1913
NIWA ‘seven-station’ temperature series: annual data for mean temperature [XLS 23 KB]
https://niwa.co.nz/seven-stations
1913 being the first full 7 stations in the series.
BE and GISTEMP breakpoints and adjustments for the same time period are totally inconsistent. One may have a break the other not. One may have a (+) adjustment at a break the other a (-) or none at all. Same all over the planet and easy to demonstrate.
HadCRUT4 uses NIWA’s 7SS above for NZ which is so completely inconsistent with BE as to be a world apart (literally – see above).
120
High praise, indeed.
70
Quoting a Berkley Earth “skeptics” guide from 2014 is just a real laugh.
Everywhere is says “global warming” not “climate change”.
The narrative had been changed now because the global “warming” wasn’t happening.
Real science skeptics verses skeptics marketing. It’s now a derivative market.
Berkley is the marketing arm of …
100
Simon
I identified a large number of cooling trends some years ago and wrote about it here
https://wattsupwiththat.com/2010/09/04/in-search-of-cooling-trends/
I was intrigued by the large number identified from a relatively small overall number and estimated it at around one third of the total number of overall data bases.
I was aware that Dr Mueller at Berkeley was coming up with a new global data base and exchanged a number of emails with him and before the official release of Berkeley he confirmed the number of data bases that were cooling in his extensive records to be around one third so closely following my own figures.
I don’t think that during the Numerous warm periods during the Holocene or the corresponding cold ones, that EVERYWhere in the world was cooling or warming at the same time.
It seems as if the current moderately warm period is probably following the same pattern. We have an overwhelming volume of records that show the modern era is, compared to the past, not at all out of the ordinary
tonyb
120
tonyb, re:
‘In Search of Cooling Trends’
by Verity Jones and Tony Brown (tonyb)
https://wattsupwiththat.com/2010/09/04/in-search-of-cooling-trends/
Raw station data such as the above documentation and graphs reveals the reality of global and local climate that homogenization obliterates and distorts.
It is good to have some ready examples at hand to present in debates. I brought up Hobart upthread due to BEST pulling it in at the beginning of their NZ series but it only begins 1918
Hobart 1918-2020
http://www.bom.gov.au/cgi-bin/climate/hqsites/site_data.cgi?variable=meanT&area=aus&station=094029&period=annual&dtype=raw&ave_yr=0
Even short the Hobart series still exhibits the same sine wave appearance to those graphed in the ‘Cooling Trends’ post (as do all stations in NIWA’s NZ 7SS series even after homogenization).
My interest is, using 5 yr running average and roughly:
Hobart Mean 80 years apart:
1920 13°C,
2000 13°C.
I was intent on looking up Adelaide because there is considerable knowledge around of the station(s) and it is long running. So good to see this:
Found the graph by clicking on your name hotlinked at top of post to ‘Little Ice Age Thermometers’: http://climatereason.com/LittleIceAgeThermometers/
Adelaide Airport 1879-2002 and Mildura Airport:
http://climatereason.com/LittleIceAgeThermometers/Murray-DarlingBasin_Australia_Large.gif
[Joanne, if you see this. For the record more than any thing and useful to come back to as is a lot of other stuff in this thread. I doubt Tony will see this unfortunately]
10
BOM only has Adelaide 023000 1911-2020:
http://www.bom.gov.au/cgi-bin/climate/hqsites/site_data.cgi?variable=meanT&area=aus&station=023000&period=annual&dtype=raw&ave_yr=0
From: Australian climate change site networks
http://www.bom.gov.au/climate/change/hqsites/
No doubt I could access more station data with some digging at source but I’m after ready-at-hand examples that I can quickly pull up. Tony’s graph previous does nicely in combo with BOM’s graph. Basically:
Adelaide Mean 80 yrs apart:
1920 17°C
2000 17°C
10
Go away Simon you’re a first class fool and an embarrassment to Australia.
But you’ve a lot of delusional mates who’ll even believe that we’re now living in bleakest of times and somehow we also face an EXISTENTIAL threat.
Even the so called leader of the free world now believes this nonsense and nearly all of the clueless clowns who flocked to Glasgow in 2021.
Of course the data and evidence proves you’re wrong, but I know you’re too stupid to understand.
Thanks again Jo and your arguments using data and over 200 years of our history proves again that we have a lot of clueless donkeys who’ll believe any fairy tale and fantasy that suits their purpose.
541
Not sure Sleepy Joe actually believes in anything. He just believes in things he’s told to believe in.
150
>”Not sure Sleepy Joe actually believes in anything”
He believes in ice-cream – fervently.
70
‘ … this weather system is a typical east coast low.’
That is true and East Coast Lows are more common in early winter.
Looking at South East Australia over the first half of the 19th century it was wet from 1836-38, which indicates La Nina conditions, but no ECL off Sydney.
‘Prolonged dry conditions were identified in various parts of the region during 1837–1843 and 1845–1852, while wet conditions were noted from 1836 to 1838, primarily in southern SEA. Anomalously cold periods were also identified in 1835–1836 and 1848–1849, in general agreement with temperature reconstructions from other regions of the Southern Hemisphere.’ (Ashcroft et al 2014)
90
Wikipedia has a decent summary of the Nepean-Hawkesbury.
The 4 upstream dams on the Nepean and tributaries aren’t terribly big, and are dedicated water supply dams. Warragamba dam is quite large, but is also a water supply dam. Any flood mitigation effect is incidental, generally when the reservoir is well below capacity. I don’t think there are any significant reservoirs on the Grose.
Once the dams are full, there isn’t much scope for control.
The proposed extension to Warragamba dam to provide flood mitigation capacity may help in future floods, but only for one of the three major tributaries.
Once the soil is saturated and reservoirs are full, even a cow piddling in the upper Nepean is going to bring a fresh down the river.
The executive summary is that the water flows are really only “much more controlled” after a long dry spell when the reservoirs are low.
170
Simon >”Individuals may say that a single event is due to climate change”
What individuals? What single event? What on earth are you alluding to?
From the post:
“The Guardian” are “individuals”?
“Part of life” is a “single event”?
“200 years” of “nothing has changed” is “climate change”?
Your comment in respect to this post is disconnected – a non sequitur:
150
Simon >”Comparing flood levels can be misleading because water flows are much more controlled now”
“More controlled”? How so? Please explain.
Even The Conversation, via Newshub, has a completely different explanation:
From:
‘Sydney flooding analysis: Driver of disaster is nature, infrastructure and lack of preparation’
https://www.newshub.co.nz/home/world/2022/07/sydney-flooding-analysis-driver-of-disaster-is-nature-infrastructure-and-lack-of-preparation.html
# # #
Nothing about “more controlled” “water flow” – just the opposite.
80
Isn’t the Warragamba Dam an attempt to control water flow? The problem with dams is they work only until they overflow.
212
And then people just say Damn.
70
The proposal to increase the wall height of Warragamba Dam is an attempt to control water flow in the future from one of the major tributaries of the Hawkesbury, but doesn’t have any effect on flow from the upper Nepean or the Grose.
Warragamba dam is currently a water supply dam, but the increase in height is currently intended for flood mitigation.
In contrast, Wivenhoe Dam in SE Qld was intended as primarily flood mitigation, but was increasingly used for water supply.
120
During WW2 there was critical shortage of water in Sydney, so they began construction on Warragamba Dam in 1948.
60
Simon >”Isn’t the Warragamba Dam an attempt to control water flow?”
Not yet apparently:
Designed for water supply not control:
AUSTRALIA’S LARGEST URBAN WATER SUPPLY DAM
https://www.waternsw.com.au/supply/visit/warragamba-dam
90
Ah, he concludes against his own idea!
30
Simon >”What is different is the unusually warm ocean temperatures driven by La Nina and the overall warming trend.”
Yeah right.
ALL-TIME COLD RECORDS FALL IN AUSTRALIA
https://electroverse.net/cold-records-fall-in-australia-solar-activity-controls-climate/
And,
How exactly does a -0.1C anomaly for the entire month prior to the most recent flooding and hundreds of monthly low temperature records falling over the past two days reconcile with your “overall warming trend” ?
110
‘What is different is the unusually warm ocean temperatures driven by La Nina …’
Thanks, I was unaware of the marine heatwave.
‘Sea surface temperatures over the Tasman Sea have been exceptionally warm this year. This started with a record-challenging marine heatwave in January and at the start of July, there is still a pool of water sitting off the NSW coast that is about 2 to 3C warmer than average. This abnormally warm water has enhanced evaporation and provided an extra source of moisture for rain-bearing systems passing over NSW.’ (Weatherzone)
51
Eastern Australian mainland temperatures are actually cooler than average this year as Richard C pointed out…Warm ocean waters off the eastern Australian coast are a pattern consistent with the cooler waters in the equatorial eastern Pacific associated with a La Nina ..
30
‘ … and the overall warming trend.’
Warming stopped quite sometime ago, seven years to be precise.
https://www.drroyspencer.com/wp-content/uploads/UAH_LT_1979_thru_June_2022_v6.jpg
80
Simon >”What is different is the unusually warm ocean temperatures driven by La Nina…”
Except not entire East Coast Australia according to NIWA observation based forecasts (1993-2016 base):
Sea surface temperature update
https://niwa.co.nz/climate/sea-surface-temperature-update/sea-surface-temperature-forecasts-june-november-2022
2022-06 2022-07
https://niwa.co.nz/sites/niwa.co.nz/files/styles/full_screen_feature/public/nz_sst_panel-JUN-NOV-22.png?itok=r521b4Y5
The southern NSW coast is minimally warmer (0 to +0.5) but northern NSW and out in the Tasman is cooler (0 to -0.5).
Bondi water temperature is nothing extraordinary:
Current Bondi water temperature is already within the range of normal annual lowest with 10 days to go – how is that “unusually warm”?
120
that is total speculation because there is no reliable data (measurement) from 1867 that supports it.
prove me wrong.
80
The Southern Ocean is bucking the trend. It has a negative correlation with CO2:
http://climexp.knmi.nl/data/isstoi_v2_0-360E_-55–65N_n.png
Heading down at 0.66C per century.
The Nino34 region is also trending down:
http://climexp.knmi.nl/data/isstoi_v2_190-240E_-5-5N_n.png
Trend is down at 0.16C per century.
You would expect the Northern Hemisphere to be warming given that solar intensity from 25N to 35N has increased by 0.06W/m^2 since 1980:
http://climexp.knmi.nl/data/isstoi_v2_0-360E_25-35N_n.png
Going up at 2.6C per century, in line with increasing solar intensity due to orbital changes.
Follow the sun due to orbital changes if you want to really understand climate change.
110
Comparing flood gauge levels is not at all ‘misleading and your argument is deceptive and superficial as not all river systems are dammed and water flows ‘controlled ” [ Notice Simon has not provided any citation ] If anything dams and reservoirs can mitigate floods to some extent which means the floods of last century were considerably worse..Your argument is typically nonsense .
The 2021 IPCC WG1 findings on anthropogenic attribution to flooding is the same verdict as the 2013 IPCC report : ” In summary there is low confidence in the human influence on the changes in high river flows on the global scale . Confidence is in general low in attributing changes in the probability or magnitude of flood events to human influence ” Low confidence can best be interpreted as no solid convincing evidence for an anthropogenic climate change signal. Has anyone passed the memo to Prime Minister Anthony Albanese the Climate Council and the ABC ? 15 years ago the Bureau of Meteorologys David Jones was quoted warning the Millennium Drought may be our ‘new normal ” and climate commissar Tim Flannery who in all seriousness compared himself to an Old Testament prophet issued the jeremiad that our ‘dams and river systems may never fill again and Perth would be a dessicated ‘ ghost city ” Now we hear of ” the science ” predicting these floods were inevitable and they are portents of climate change ..This is what one sees in the mythos of apocalyptic cults
Furthermore flood severity and magnitude is not solely determined by precipitation intensity despite the precipitation index rising over the last century The hydrological expert Sharma and his colleagues published a paper in 2018 [ If Precipitation Extremes are Increasing Why Aren’t Floods ?] exploring the conundrum and found that : ” Despite evidence of increasing precipitation extremes ,corresponding evidence for increases for increases in flooding remains elusive .If anything ,flood magnitudes are decreasing despite widespread claims by the climate community that if precipitation extremes increase flood must also ” Their findings have not been refuted over the elapsing four years. I wonder why the Sharma et al publication might be absent from the ABC and Climate Council websites ?
Floods are exacerbated by a panoply of factors including human terraforming and habitation ; river basin size ; soil moisture and snowmelt
This statement of Simons is also deception by omission . What I call ‘climate kitman ” : ” What is different is the unusually warm ocean temperatures driven by La Nina and the overall warming trend ”
The La Nina phenomenon is caused by an increase in cool waters and cooler atmospheric temperatures in the equatorial eastern Pacific and there is nothing unusual about the Pacific ocean temperatures. According to NASA ” The atmosphere cools in response to the cold ocean surface ” during a La Nina . The warmer ocean waters off eastern Australia are the flipside of the natural Pacific La Nina oscillation and eastern Australian summer and autumn temperatures were actually cooler than average this year.
40
I would question the “controlled water flow” idea.
It would mean that our controls actually work the way they are designed.
There is plenty of evidence that this is not so.
Plus housing being approved and build in flood prone areas.
30
Morning Jo,
…& the Hits just keep coming!!
How do you do it Jo?
There’s 2 scarily always accurate truisms that the Climate Cult never seem to grasp:–
1. Those that are ignorant of the lessons of history are condemned to repeat it; &
2. One definition of insanity is to keep doing the same thing over & over, hoping for a different outcome.
(The 2nd of course being an Einstein quote/words to that effect.)
This Green “Bernard-Madoff-like” Pyramid Scheme truly has almost everyone sucked in.
Dystopian regimes like; S.A., Sri Lanka, Germany, U.K., N.Y., & California are proudly showing us how to turn clocks back literally 250 years in just a decade.
I just hope people wake up before the end of this decade.
In our lifetimes, we are witnessing the Greatest Greek Tragedy the world has ever seen!!!
Warm regards, reformed warmist of Logan.
340
“& the Hits just keep coming!!”
It is an excellent post that really puts the fashion statement people from your point number 1 into their true rank as loud and arrogantly ignorant nuisances.
Your point two provides an IQ test. They can pass by becoming “reformed warmist”s.
10
From the confluence (10 feet above sea level) of the Nepean and Grose Rivers, the Hawkesbury River meanders about for 75 miles. This is, more or less, a swamp.
I find swamps interesting places to visit, but do not care to live in one.
260
Not really a swamp. More like a river Flood Plain. They exist all over the World and are subject to flood waters. Hence the name. Nearly the whole of Bangladesh is one.
230
In Dorothea McKellar’s land of “droughts and flooding rains” as the Climatebaggers gather there is always Said Hanrahan by Patrick Joseph Hartigan
“There’ll be bush-fires for sure, me man,
There will, without a doubt;
We’ll all be rooned,” said Hanrahan,
“Before the year is out.”
but who needs the wisdom of generations past and even printed history when you have one simple reason to fear life on earth, carbon dioxide.
or the Australian/Wall Street journal this week slammed coal as the ‘dirtiest’ fuel. In fact all fossil fuels burn to invisible Carbon dioxide and water, but apparently carbon dioxide is a noxious emission where in fact H2O is the deadliest emission as you can see in the Hunter valley today.
And the line “international efforts to keep the rise in global temperatures from pre industrial levels under 2C by the end of the century.” It is odd that the start point for the terrible warming happens to be the end of the Little Ice Age in 1870. We are not back to even the middle ages temperatures and well under Roman temperatures. Those poor Romans and that unfortunate Renaissance when crops were plentiful and the wines were good, even in Scotland.
Anyway, the world is rapidly cooling for the next few decades, which means they will all need more coal for heat while preventing warming. To some that makes sense. And when the inevitable drought to end all droughts comes, we can bemoan the lack of dams as we can bemoan them in the current floods. And we will quote Hanrahan
“If rain don’t come this month,” said Dan,
And cleared his throat to speak –
“We’ll all be rooned,” said Hanrahan,
“If rain don’t come this week.”
270
Or more simply from the famous Spanish philosopher
“Those who cannot remember the past are condemned to repeat it.” – George Santayana, The Life of Reason, 1905.
221
Actually my favorite quote from Santayana is about men and women
“When men and women agree, it is only in their conclusions; their reasons are always different.”
190
And it just occurred to me that “international efforts to keep the rise in global temperatures from pre industrial levels under 2C by the end of the century” is ridiculous.
It means that rapid Global Warming is already in its third century so from 1860 to 2100 the object is to reduce rapid warming from the current terrible 1.5C in 140 years to 2.0C in 240 years, a current rate of 0.5C per century? Oh, the humanity. It certainly redefines rapid. And who will survive another whopping 0.5C in a mere 78 years? It’s goodbye Antarctica, an ice block the size of South America and 3.5km high where the temperature for most of it is never above -25C.
And in the UK they are predicting 31C soon! And even high thirties for a week or so. How will they survive? And when will this rapid sea rise sweep them from the Spanish beaches of the Costa Lot? You wonder where the Extinction Rebellion kids are holidaying with their parents?
120
That is a great Article especially reading those observations from the people who were there at the time of those floods. When you look at a Chart of those flood levels since 1799, the flood of 1867 peaking at at 19.68 metres looks to be an Outlier as all other highest peaks never reached the 16 metre level! But that 1867 peak happened and by then the measurements can be considered more accurate than those of the earlier years.
Just like the measurement of temperatures are much more accurate now that say the 1800s and before.
There obviously needs to be greater flood mitigation measures implemented. Over to you NSW State Government.
170
There is a huge amount of variables with floods.
Especially with the relatively small catchments of the eastern sea board.
A heavy storm in the catchment of minor creek.
If the timing is exactly right and it joins the main catchment right at the flood peak, can push the level to record heights.
A few hours either way and it just extents the peak a bit longer with out getting any higher.
80
You say that flood of 1867 is an outlier, but we really don’t know because Australia doesn’t have any decent long term weather records. There may have been bigger flood heights in previous centuries. We only have the passed down memories of the inhabitants of this country pre 1788. We know they are unreliable. A great proportion of Australia’s inland rivers and creeks spend most of their time bone dry. Yet, you can see the banks of those same waterways a great distance away from the lowest point. Then you realize that all you need is a great flood every eg. 100 years over thousands of years to create that river topography. But, within that timeframe, humans may never actually witness that river flood.
80
You are correct. However, I was referring to that level as being an outlier on the chart of the flood levels from 1799 to the Report of the February 2020 Flood (The Report was dated June 2020).
20
This page gives the full list up to the present day
https://www.insw.com/media/3146/records-of-flooding-in-the-area.pdf
Note: the frequency of floods is the same even after the warragamba dam was built. This is because of the bathtub effect which puts Windsor on the wrong side of a narrow choke point, geographically speaking
910
Unfortunately the Nepean and Grose rivers are downstream of Warragamba dam.
100
Warragamba dam covers quite a bit of the more southerly and south-westerly catchment, but is also a dedicated water supply dam with little scope for flood mitigation except by happenstance.
131
And this is why the flood mitigation needs to take account of the Nepean River, the Grose River and even South Creek and Eastern Creek. Even the Colo River can be a problem as it can cause a back up of water on the Hawkesbury. The floods of February 2020 would have been much worse had the Dam been nearly full. As it was, the Dam was around 43% full when the deluge came. This time, the Dam was nearly full before the rains came. Not a very good situation to be in.
https://www.parliament.nsw.gov.au/lcdocs/other/13410/Presentation%20-%20Infrastructure%20NSW%20-%2030%20June%202020.pdf
80
The Climate Council is out of control and ramping up the public disinformation meter ….
https://www.news.com.au/technology/environment/climate-change/albanese-government-called-to-action-over-biggest-security-threat/news-story/d2d6191901f1c40508a36a713b3bb054
In 8 years? Such nonsense. Australia contributes about 1% of global emissions so they only thing Australia will “curb” is its economy and risk killing people who can’t afford to stay warm or cool depending upon the season or simply because we end up with frequent power shortages. Just nonsense.
320
The problem these people face.
Is the ‘use by dates’ that used to be a comfortable distance into future (AKA past the end of their careers)
Are now starting to loom into ‘real time’
180
The Climate Council are becoming godlike. I have noticed that they are providing data to a number of weather / climate related media articles. It would appear they are regarded as being akin to a fact checker, or that their data can’t be challenged. I expect they will gain more prominence during the Labor government.
90
Cult-like .
20
https://www.smh.com.au/national/governors-phillip-and-macquarie-warned-about-building-in-the-path-of-floods-still-we-don-t-listen-20220303-p5a19i.html
SEE LINK FOR REST
NEVER BUILD IN FLOOD PLAINS, BUSHFIRE ZONES WITHOUT CLEARING OR IN EARTHQUAKE ZONES WITHOUT RESISTANT STRUCTURES
190
You would think that in a land of deserts, droughts and flooding rains Australians would be world leaders in storing, managing, distributing water. But here we are, 200 years later, victims of the totally predictable. And that without computer Climate models.
280
We are led by mental midgets.
170
Yes and we used to have Mentors. Now we have Tormentors.
150
But they are rich midgets.
110
Governor Macquarie wrote to the Earl of Bathurst in 1817 complaining that {the settlers} had “an infatuated obstinacy in persisting to reside with their families, flocks, herds, and grain on those spots subject to floods. They have often had their prosperity swept away”.
Just shows that human nature does not change . Now those who are responsible for putting people at risk have something to blame; C02 .
80
I don’t think we allowed to say midget now, not PC.
https://www.lpaonline.org/the-m-word
40
Correct, we now refer to them as Olympians.
40
The main reason these events are reported as being ‘unprecedented’, is because the reporters are aged between 19 and 21.
260
My mother comes from Grafton, NSW, and she said, even back in the day, and even after floods, people would continue to build in known flood zones.
Sadly, it’s human nature to do stupid things, and continue to do them. Even more so today, when people are the most dumbed-down they ever have been in the post Enlightenment era.
220
In 1981 on a visit to Windsor my father got out of the car, looked around for less than 10 seconds and said “they have bad floods here”.
I asked how did he know, and he said “all the old houses are on the ridge”.
Then I told him that there were 2 big subdivisions going ahead up-river on the flood plain. We agreed that I wasn’t going to buy a house up there, but many did. There were 2 floods a few years later.
180
Hi David, my mother was born in Grafton and grew up in Woodburn, they had a dairy farm and got flooded so many times they moved to Warwick.
100
Around Maitland on the Hunter River, a lot of the problem is folks blowing into the district from Sydney or wherever with zero knowledge of local flood history or dynamics, along with younger locals who have never seen a big flood. The young city engineers have the same lack of local knowledge. Every flood is different, but they do share some common traits known best to older locals.
After the 1955 flood there was a mass exodus of houses being moved up onto high ground. Any new houses built on the floodplain were required to be on stilts or on raised mounds, but basically housing development on the floodplain was stopped in its tracks.
So now we have three generations with no local flood knowledge plus engineers who think that floods are a thing of the past and it is quite OK to develop the flood plain once more. They base their confidence on the levee system, but the town centre has nearly gone under two or three times since the levees were strengthened in the early 70s. In time there will be a disaster that makes 1955 look tame.
90
A couple of years ago I read that according to local Indigenous Australians flooding where Maitland-Morpeth and other towns in that part of the Hunter River has well exceeded the worst experienced since white settlement.
On the drought side the Hunter River has been dry from above the high water tidal mark upstream and for years at a time forcing the tribes to joint together and live in the hills where spring water remained available.
60
Yes, the early settlers were told by the Aborigines that they had seen huge mega-floods in the past, one where kangaroos were trapped and washed off the hill on which the old Maitland hospital now sits — which would make the water probably 70 feet deep on the floodplain.
The south western tributary of the Hunter is Wollombi Brook. A fluvial geomorphological study of the Brook was undertaken some years back. It revealed a depositional history that shocked the people doing the study. What they found was that in the several hundred years prior to white settlement there were floods on a scale unimagined; floods that would make the 1955 monster seem a trivial event.
If something on that scale happened now it would wipe clean the face of the lower Hunter Valley except for the higher points. Infrastructure would be a shambles for months/years. The hit to the economy would be lethal. All of the export coal from the Upper Hunter, Gunnedah and Gloucester mines has to go through Maitland. In 1955 the rail lines were ripped to pieces by that flood.
During extreme drought the tribes used to trek to Barrington Tops to find water. That’s quite a walk if you know the Hunter.
80
My great grandfather arrived by ship berthing at Morpeth (Maitland) and separately at another time my great grandmother arrived with her parents and family by ship, mid 1800s.
One of the ships of three that her family and extended family sailed on was named Maitland.
70
That would be the same ship the Maitland Gale was named after when the ship was lost off Barrenjoey in 1898, bound for Newcastle.
The Maitland Gale was a 4 day storm that was also infamous at Port Stephens for destroying the 10 feet high vegetated sand spit at Fingal Bay with a heavy north easterly sea battering the structure until it was demolished and washed into the bay. It has never re-formed or revegetated and still goes under water at high tide.
40
Never a future major flood disaster, PM Albo is tackling climate change he said.
And Pacific Island nations are very happy, waiting for cheques.
/sarc.
80
Thanks again Jo for trying to educate us about Australia’s weather extremes over a long period of time.
Horrendous floods and droughts have been with us since the first fleet arrived, but thankfully we lose very few people today from these extreme weather events and this is also the case around the world.
AGAIN, global extreme weather deaths have dropped by 95% + over the last 100 years. And the global population has increased by over 6 billion since 1920. Think about it?
180
@ 08:30 this am, QLD coal power price is $120, SA unreliable powered $4025. LOL
220
Thanks again Jo for this incredible dose of reality;
these public, historical and unquestionable details of the past are in sharp contrast with the current Government announcements.
The flow of verbal garbage from the misleadia, thanks DM, has reached extreme flood levels and dominates public debate and perception.
While driving yesterday I listened to my favourite radio station, their ABCCCC, on which a lady expounded on the government action to institute an immediate investigation of the link between these floods and, you guessed it, Climate Change caused by CO2.
She discussed the new models that were needed and she was sure that they would reinforce the need for Australia to become Carbon Neutral by 2030.
A professor from an Australian university with an American accent then expounded on the problem. Thank you President Turnbull.
“The money, the models, we need more of both, otherwise we’re doomed,” he says.
It’s like the rain, this government sponsored sickness never stops; in fact we’re being flooded and need urgent evacuation.
170
More reality from DM at #8 above.
From 1810, that’s 210 years ago, the clear and logically founded message that Rivers Flood.
That’s what they were designed to do.
But then there’s the problem of money, and if you can pretend that flood zones aren’t flood zones then it’s O.K. to sell the river banks: the buyer’s in danger and the vendor has a load of pounds, shillings and pence to hide away.
But now we’re in 2022, the new age of enlightenment, or something
140
That’s ‘rooned’.
80
The mere fact that there are geomorphic features called “flood plains” and they exist in the Sydney Basin and throughout the rest of the Australian continent should ring alarm bells. How thick is the sediment under the current flood plains? How many floods did it take to build up this thickness of sediment? It certainly didn’t happen in the last 200 years because of climate change.
HEADLINE – Old research shows that flooding has occurred in Australia for thousands of years!
110
The concerning feature of floodplain deposits is not the fact that they might be a hundred feet deep, but that individual horizons/strata in that soil column might be many feet thick from a single depositional event. That scares me. It speaks of massive floods.
I know of a flood within living memory around my district that left deposits of 10 feet deep sand and silt over a wide area.
The floodplain of the Lower Hunter has alluvial deposits between 20 and 80 feet deep, overlaying a thick stratum of well-preserved sea shells. This is 35km inland from the sea. That coarse stratum acts as a wonderful aquifer for water extraction for irrigation. I wonder how the shells got there. Maybe Flannery can tell me.
70
The shells got there as many eons ago a large part of the current Australian land mass was under the sea/ocean.
30
Some of the people flooded are blaming the govt, ‘we feel incredibly let down’, well who bought or built in a known floodprone area, huh.
Give it a rest and do something intelligent, like raise your home or move.
170
Who approved housing developments below the 2% level on flood plains?
90
Look no further than the Local Councils aided and abetted by the NSW State Government.
90
Someone in need of financial security.
50
AGAIN here’s the 2017 Ashcroft 1839 to 2017 study of the 3 cities of SE Australia, Melbourne, Adelaide and Sydney.
Dr Karoly was also a member of this study and we can observe that both Melbourne and Sydney experienced a drier period from the late 1990s to 2017.
But alas Melbourne was much drier from the late 1990s to 2017, so that wrecks their stupid claims of terrible modern floods because of more co2 in the atmosphere.
Of course we know that back to back la ninas will normally bring much higher rainfall and flooding, if we actually understand the historical data.
AGAIN all of Australia suffered a terrible drought in 2019, yet since then we’ve now experienced the two highest annual returns for farmers since records began. Look up the data from the ABS for yourselves.
https://reader.elsevier.com/reader/sd/pii/S221209471930009X?token=8BCF63B31FF6C6425320E054504722B0F6A0A277CB8B75F98791BD29DEAA242BACE3EB0AEC15628AC9F2F856C362620D&originRegion=us-east-1&originCreation=20220707222645
130
It’s strange that the Climate Change crowd bang on about CO2 driven Climate Change causing all of this rain and the floods. However, the floods are still expressed in terms of being a ‘Natural Disaster’. There you have it and I agree with the term. Mother Nature once again.
60
There is a lot of effort going into extracting money from big energy producers with deep pockets. That is based on proving the fossil fuel producers knew they were causing climate change but kept marketing fossil fuels.
Some of the dimwits in these companies actually believe that CO2 causes climate change so they are open for reaming.
If your house is flooded and someone with deep pockets accepts responsibility then you could get compensation. The insurance companies might even target the fossil fuel producers to recover their outgoings.
50
I realised recently when listening to the politians rabbiting on about floods occurring more often and getting worse due to climate change, as expected ‘according to the science’.
What we don’t hear is how the same politicians are building better infrastructure or changing building codes to allow us to weather (pun intended) the floods that will still occur, although not more often or worse than currently.
They do not usually claim that ALL floods (and other natural events) will be forever gone when we reduce CO2 and our lives to subsistence levels so why are there no major engineering projects to mitigate the weather anomalies that will still occur (as evidenced by Jo’s long list of floods)?
70
Again here’s Australian rainfall since 1900 from the BOM.
Note the severity of the 2019 drought and THINK. But also note we are now living in the best of times for rainfall ( except 2019) and we certainly wouldn’t want to return to that terrible period from about 1921 to 1949.
But Australia has always had extreme droughts and floods and this has probably been the case for thousands of years.
Australia is the driest inhabited continent, but also note the moving average line for overall rainfall has improved since the late 1960s.
http://www.bom.gov.au/cgi-bin/climate/change/timeseries.cgi?graph=rranom&area=aus&season=0112&ave_yr=8
60
It is probably beyond repair. The NSW SES has an online video showing how prone the Hawkesbury Nepean system is to flooding, when quite heavy rain occurs in the basin, and the topography means it will flow in one direction only to the sea, creating flood ponds to the sea.
In the early 1800’s it made sense to farm on good land, close to the Sydney markets. A flood might take your shack away and inconvenience you, but nowadays cost of the household furnishings is huge. Who were the lame-brained cretins who thought that the fertile flood plains ought to be converted to housing estates? Perhaps they are related to the planners whose efforts were rewarded with the devastating Brisbane floods. The 5-fold increase in population in past 60 years is the fault of NSW political/planning decisions. The topography will not change, and the rain gods will do their own thing. Not my concern-over to you NSW.
80
and thank goodness they stick to reporting news and relevant information. What is the point of adding such irrelevant information to the reporting on a flood in progress? But wait… how about all the media discussion about housing in flood prone areas. “Flood prone” is an explicit reference to all that stuff about past floods only without the boring detail that this post went into…
Oh and aside from all that they do mention it
215
‘ … the boring detail that this post went into…’
Strongly disagree, we are discussing climate change.
The ABC article on the jet stream by Deacon (which Simon put up) is a breakthrough for Aunty. Its a recognition that natural variability is more powerful than a benign trace gas.
110
maybe so but what was presented was some history, not data, nor context nor anything resembling observed vs expected. In any case the premise that current reporting ignores the past is a red herring.
38
The MSM has been slack on climate change, but with the help of Sky we have forced Aunty to get real. There is little doubt that the ABC and SBS have been barracking for the global warming hypothesis.
Anyway that is set to change now that global cooling has recommenced, with the Interdecadal Pacific Oscillation leading the charge, accompanied by La Nina like conditions.
https://climateimpactcompany.com/daily-feature-intense-negative-multivariate-enso-index-indicates-robust-la-nina-climate-continues-2/
60
The northern hemisphere has only just started to warm. It is true that 2020 had more sunlight than every other year this century so far but it is not the highest this century.
Did you know the Southern Ocean is steadily cooling but not enough to offset what is happening in the Northern Hemisphere:
http://climexp.knmi.nl/data/isstoi_v2_0-360E_-55–65N_n.png
The increasing trend in the Northern Hemisphere will continue and outstrip the cooling in the Southern Hemisphere. By 2100, the NH will have up to 0.2W/m^2 more than now. South Pole will be down by 0.8W/m^2 but the crossover is south of the Equator. On average, it will be warmer by a significant amount in 2100 than now and it has nothing to do with CO2.
Predicting cooling is OK for the next few years. 2021 had 0.05W/m^2 less at the Equator than 2020. It will be 2031 before we get close to 2020 but there is warmer to come after that. However the long trends are for NH warming and SH cooling. NH winters will be getting cooler though while the summers warmer.
50
could you please clarify this
more than every year but not the most?
26
So far this century 2020 has had the most sunlight (closest to the sun on average throughout its annual orbit).
2031 will be similar to 2020.
The northern latitudes will have higher solar intensity in 2058 than 2020 but not by much.
By 2500, the northern latitudes will be getting 0.2W/m^2 more than 2020. However the summers will be considerably warmer but winters cooler. That is about the time snow will begin to accumulate again.
The South Pole got 0.6W/m^2 less in 2020 than 1500 but the NH mid latides has increased by 0.2W/m^2 between 1500 and 2020. The land responds more than the ocean to these changes in solar intensity so the global temperature is increasing and will continue to do so for a few centuries.
51
‘Predicting cooling is OK for the next few years.’
How about the next 20 years? Its going to be cool and wet in Australia and its all down to the Interdecadal Pacific Oscillation. A phase lasts around 20-30 years and we are going into a negative phase.
The eighteenth century gives us a clear picture of the phase change.
‘The century began with a strong positive phase from ~ 1685–1705, a sharp negative phase from 1725 to 1740, a positive phase from 1740 to 1760, negative from 1770 to 1780, and strongly positive from 1780 to 1795.’ (Buckley et al)
‘The three positive phases were coincident with some of the most societally significant periods of drought for the region over the past
60
I am not even considering Australia. Most of the present global warming is coming from the land in the northern hemisphere – a little from adjacent oceans as more surface area hits the 30C limit. Australia’s temperature record is not very useful in its homogenised form and that is all that gets reported. You could be freezing and the BoM will tell you that it has been hot in Australia. So Australia’s data is meaningless; it will be whatever the BoM thinks it should be.
So my prediction is that the long-term trend for global temperature is up. Hoping to see the “pause” extend is wishful thinking. There is no trend in the Nino34 region. It is in permanent pause. It has slightly negative correlation with CO2 levels.
Surface water across Australia will guarantee it remains cool until the next El Nino and it will come.
60
I expect the AMO to slip into negative mode within a few years, then the NH will get cool.
https://stateoftheocean.osmc.noaa.gov/atm/amo.php
30
NEVER forget:
It’s THEIR ABCess!
10
The BBC says some conspiracy theorists have been blaming weather modification.
https://www.bbc.co.uk/news/science-environment-62049654.amp
Normally I would scoff, but the fact that the BBC is denying it and throwing in the vax/moon landing line, it’s probably true!
80
Interesting to note that WA also suffered from the severe 2019 drought, but overall WA has had much higher rainfall since 1995.
But the SW of WA has also had less rainfall since the 1990s. That co2 is certainly a remarkably MAGIC molecule,SARC.
But the recent O’Donnell study also found that the SW of WA has more rainfall today compared to the past 400 years.
http://www.bom.gov.au/cgi-bin/climate/change/timeseries.cgi?graph=rranom&area=wa&season=0112&ave_yr=8
70
Severe drought in WA in 2019? Where? The last prolonged severe drought in WA was in the northern wheatbelt in the mid-70s. No doubt it will be our turn again.
50
And once again Simon et al appear with their agitprop. They are the written equivalent of a vuvuzela at a soccer match.
101
At least they are at the match. Not like some.
311
GI you display no knowledge of science whatsoever.
70
mm k
13
I love the term ‘Climate Grifter’.
90
Again here’s a quick summary of the 2021 O’Donnell rainfall study of the SW of WA and the terrible mega- droughts over the last 700 hundred years. Here’s a quote and the link.
https://theconversation.com/we-found-a-secret-history-of-megadroughts-written-in-tree-rings-the-wheatbelts-future-may-be-drier-than-we-thought-160526
“Our recent research, however, found these dry conditions are nothing out of the ordinary for the region.
In fact, after analysing rings in centuries-old tree trunks, we found the region has seen far worse “megadroughts” over the last 700 years. Australia’s instrumental climate records only cover the last 120 or so years (at best), which means these historic droughts may not have previously been known to science.
Our research also found the 20th century was the wettest of the last seven centuries in the wheatbelt. This is important, because it means scientists have likely been underestimating the actual risk of drought – and this will be exacerbated by climate change”.
50
Apart from modern climate change which we are told makes everything worse (never better though), is there a possibility that there are historical periods when flooding is most likely to occur, or conversely, less likely. The problem has always been timespan of records, especially when these cycles could be hundreds of years.
I came across this image of flooding in a particular valley in the Czech Territory, going back to 1,000AD. It clearly shows in this instance that there were extended decades where flooding was less likely to occur, and that they were periodic.
It would be possible that there were periods of time when flooding in this valley did not occur in a lifetime, and therefore the inhabitants can get lulled into a false sense of security, especially when flooding events may be cyclical on multiple decades.
40
As per the Report to the NSW State Government (February 2020 Floods) that I referenced earlier, there have been 6 periods deemed to be ‘Flood Dominated’ or ‘Drought Dominated’ identified since 1794. These are real Scientists that we are talking about here IMHO and not the Climate Change ‘scientists’.
As stated in the Report. Scientists observed these longer term wet and dry cycles.
Flood Dominated being more frequent and larger floods
Drought Dominated’ being less frequent and smaller floods
– Flood Dominated – 1794 to 1820
– Drought Dominated – 1821 to 1856
– Flood Dominated – 1857 to 1900
– Drought Dominated – 1901 to 1948
– Flood Dominated – 1949 to 1990
– Drought Dominated – 1991 to the date of the Report (2020)
The Report also indicates that these two Cycles last 30 to 50 years. Shame that they don’t have at least 10,000 years worth of data to analyse.
The Report also states –
About floods – likelihood or chance of a flood
– Floods are naturally occurring probabilistic events
– Smaller floods occur relatively frequently – large floods occur infrequently
I do like that bit. Floods are naturally occurring probabilistic events.
Now, over to those Climate Change Alarmists for a considered response.
Here is that Report again –
https://www.parliament.nsw.gov.au/lcdocs/other/13410/Presentation%20-%20Infrastructure%20NSW%20-%2030%20June%202020.pdf
40
Hello JS
Thanks for the link – an interesting report, especially the identification of the flood/drought dominated cycles. I have cast a “climastrological” eye over the data and presented it here.
There is a touch of sarcasm in the linked assessment, but if true, the poor folks on the floodplains and surrounds are in for a hard time for decades. If “climate change” due to CO2 brings on drought as some have predicted, it may be a better alternative for the floodplain dwellers. Sadly, someone on this wide, brown and sometimes very wet land is unhappy whatever the circumstances.
50
No – it is a certainty. The climate is always changing. The only constant is change. THe Mediterranean will go into regular summer monsoon in centuries to come. That will make Northern Africa wetter.
I can now give you a good idea of long term trends.
https://1drv.ms/u/s!Aq1iAj8Yo7jNhFzCATi2JCEkwR8t
These are all measured trends across regions of the globe. I predicted these from the changes in solar intensity due to orbital changes (that is how I selected the regions) and the immutable limit of 30C for open oceans. Notice that the Nino34 record shows the 11.8 year beat of Jupiter’s orbit. The NCEP measurement is reliable and accurate. It combines satellite and moored buoy data. I think it incredible that we can pick up Jupiter’s beat in the temperature record on Earth.
2020 was the warmest year so far this century. 2031 will almost match it. However it is inevitable that the Pacific will swing to El Nino mode in due course. To determine that, requires looking at salinity levels across the tropical Pacific. The last big El Nino was 2015/16. See the peak on the Nino34 temperature.
The NH is not far off getting more winter precipitation as the winters get less sunlight. This will eventually lead to snow accumulation but hundreds of years down the track at least. Snow accumulation will peak in about 9,500 years.
These are the things that climate scientists should be working on rather than producing disturbing fairy tales for the kids who do not question what they are being taught.
50
Isn’t it almost unbelievable that the BOM website STILL does not support HTTPS addressing? I say ‘almost’ because, apparently, all their tech geniuses must be fully occupied with homogenising past temperatures to fit their narratives and so don’t have time to catch up with what the rest of the world has been doing for several years.
80
AGAIN here’s a quick summary of the long record from corals, trees etc that proves AGAIN that Australia has suffered more severe droughts over a very long period of time. Even our recent Millennium drought wasn’t unusual compared to the last 500 years.
https://theconversation.com/500-years-of-drought-and-flood-trees-and-corals-reveal-australias-climate-history-51573
“Australia is the land of drought and flooding rains, and in a recent paper we’ve shown that’s been the case for more than 500 years. As part of our Australia and New Zealand Drought Atlas we’ve published the most detailed record of drought and wet periods (or “pluvials”) since 1500.
The data reveal that despite the severity of the Millennium Drought, the five worst single years of drought happened before 1900. But 2011 was the wettest year in our 513-year record”.
70
We should ask the caretakers of Indigenous science to advise us when floods are expected and how they suggest we should avoid the problems caused to our humpies. Their records and local experience extend thousands of years further back in time than ours.
53
They have no records as they had no writing system.
They have folk memory only.
And because they had no permanent structures, they could easily move from flood zones as levels increased.
Flood zones are readily established by topographic maps and likely frequencies from over 200 years of written records by European settlers.
These records and observations will no doubt agree with indigenous observations and folk memory.
Not sure what “indigenous science” is. Is it different to regular science?
100
I believe Katzen was being facetious.
80
OK. It wasn’t obvious. I keep seeing things that one might assume to be satirical but turn out to be true…
60
Did you know supposed “climate change” causes increased volcanism?
Remember boys and girls, just as sensible people don’t build in flood, bushfire or earthquake zones, don’t build in volcanic zones either…
This is from the once-reputable Scientific American. It is now fully woke and fully dumbed-down, ever since Holtzbrinck purchased it in 1986.
https://www.scientificamerican.com/article/get-ready-for-more-volcanic-eruptions-as-the-planet-warms/
CLIMATE CHANGE
Get Ready for More Volcanic Eruptions as the Planet Warms
A new study shows that even relatively small-scale climatic changes affect volcanic activity
By Annie Sneed on December 21, 2017
SEE LINK FOR REST
71
This idea that melting glaciers may permit disruption of the mantle means volcanoes where? Certainly not in any place which currently has no permanent ice and that’s 99.99% of the inhabited world. So it’s irrelevant. And there are active volcanoes under Antarctica, under kilometers of solid ice. So if they melt the ice they will become more active? All caused by 0.05% invisible CO2 in the air?
What it really means is that if you want government money to study something like volcanic activity or tree frogs, you have to connect them to Climate Change. Even the US military says it is the biggest threat at present to peace. So you know they want funding.
Is there any field of study which is not funded by Climate Change/man made Global Warming? No wonder we have a world of syncophanthic scientists who either agree with the absurd proposition that carbon dioxide is an existential threat or stay silent.
90
It just goes to show that the best outcome for the Sydney basin would be to depopulate it, let it return to a nice agricultural district and remove “Sydney” altogether. 80% of Australia would benefit enormously.
30
I’m sure Adellayed could make room for them.
40
It’s not as if we are not spending tens of billions of dollars are year stopping Climate Change.
The question is how many windmills will it take to fix the problem of flooding? And to prevent droughts of course. And to keep our rivers full of water.
It’s good that enough dams were built in the first half of the 20th century to provide us with a basic level of water security.
And since then, we have built lots of windmills and now huge transmission lines.
And we have not only stopped the age old problems with our climate and all the entirely new problems, we have saved the whole planet, including China.
Or not.
70
But I am a bit worried that the three massive unused French desalination plants for which we are still paying billions a year will be out of warranty before the next drought.
110
I thought that they were all in moth balls and moth balls don’t cost all that much. Maybe they need billions of moth balls which are now 1 dollar each (blame Inflation again).
30
They were financed by the French at the then existing interest rates and like so many projects, it just keeps being extended. The Chinese do the same with Belt and Road. Free stuff today, pay forever. And sure, we will keep extending the terms. That way we will pay for these drought relief devices until they go underwater with the sea level rises promised. All this is hidden from the public.
It’s like Victoria’s freeways funded by tolls. When the tolls ended, Daniel Andrew’s government just keeps it going and splits the difference with the operator, so what you pay to drive on freeways you own funds his government and half goes to the toll collector who gets massive rents on a public road. Free money for the operator and the government and most people have no idea they are paying for a road with no debt.
60
We were told that it’s flushed out to sea because its boron level is too high for human consumption and it inhibits plant growth so is no use for irrigation; a finer instance of rorting doesn’t immediately come to mind.
60
Is it just me, or have others noticed a TOTAL lack of perception from all gub’mint agencies at ALL levels on ALL matters? Or, is it actually carefully-construed MALICE? Accompanied by spectacular “spillage”.
Is there not another single sentient individual out there who can “read” a landscape”?
Does NOBODY else know what a flood-plain looks like?
Can nobody else recognize flooding potential by looking at catchment size and drainage systems?
This stuff is “bush kid” 101.
“Rebuilding” a town exactly where it was BEFORE being inundated is institutionalized MADNESS. Doing it more than once is CRIMINALITY writ large. And yet, I see no gibbets under construction nor tumbrels being dusted off.
Seeing 90ft tall trees speared horizontally into the upper branches of still-standing trees of similar size, is a salutary warning.
Is the BOM’s charter to study the weather systems and make reasonable guesstimates, or to ram radical politics down everyone’s throats? Political “science”?
60
Me too. It seems like the federal government departments are taking it in turns to be incompetent. Or maybe they are all incompetent and indoctrinated with some worse than others. Department of Defence were maybe the first with the current state of the ADF and the horrible botchups with equipment provisions- think submarines, helicopter etc contracts. Health- COVID response has been too influenced by big pharma and big health. Now, it’s the Department of Energy under the spotlight and boy are they clueless!!!
50
I grew up with floods, viewing many floods from a house on a hill on a floodplain. Probably my first memory is the 1974 flood, a real big one not surpassed since.
From that visual experience, I’ve never understood why people build houses where it floods. It is the main cause of flood damage, but always ignored. We now blame the fairies.
80
Governments have to buy back houses and land on flood plains, remove the houses and return the country to pristine beauty.
40
I purchased a house in Queensland and checked the council highest level flood map before proceeding to purchase.
During renovation and extension work holes were dug with an earth auger attachment on a bobcat for timber foundations and after removing topsoil round river stones were removed from what was obviously an old creek bed. A few years later during very heavy rain a neighbour opposite on the other side of the road experienced flooding that washed part of the backyard away and in line with the creek bed exposed during work at my house. My property escaped floodwaters because the roadway had been widened and drainage pipes placed underground to cope with overflowing gutters.
Obviously, and my house was built in the 1930s, there had been a natural creek that had been reclaimed with landfill. The area was not far from a major river that often floods.
60
Social media point to cloud seeding as the cause of the floods.
‘Experts say no single factor can explain this extreme weather, pointing instead to warmer oceans and saturated soils as contributing factors.
‘But conspiracy theorists aren’t buying it. On social media, they blame the extreme rainfall on “cloud seeding” and “weather manipulation”.
‘There is no evidence to back up such theories, but this hasn’t prevented falsehoods from reaching thousands of people online.’ (BBC)
30
Many conspiracy theorists believe that the trails from jet aircraft are cloud seeding.
They are not.
51
A chemtrail is a chemical discharged from any aircraft.
https://www.hydro.com.au/water/rainfall/cloud-seeding
https://www.abc.net.au/news/2016-06-10/cloud-seeding-carried-out-over-tasmanian-catchment-before-floods/7499226
https://www.gaia.com/article/cloud-seeding-the-confirmed-weather-modification-program
https://amp.cnn.com/cnn/2020/12/03/asia/china-weather-modification-cloud-seeding-intl-hnk/index.html
https://duckduckgo.com/?q=australian+weather+modification+company&t=chromentp&ia=web
https://climateviewer.com/2014/03/26/cloud-ionization-electric-rainmaking-laser-guided-weather-modification/
This is an Australian company, Aquiess. They say they can do it, its a regestered company.
https://youtu.be/wGAI2wdfeAE
10
NOT eat the blue ice!!
10
Well actually Dennis, sometimes they are!
It’s strange why ‘officially’ no one does this and it’s rubbished as ineffective, yet it’s done very effectively all over the world all of the time.
Of course most famously cloud seeding was used to knock the Chernobyl fallout out of the sky before it reached Moscow.
I expect the public can’t be trusted to like it so best to pretend it doesn’t happen.
20
The CSIRO’s cloud seeding experiments were inconclusive at best, but the Tonga volcanic eruption may have acted as a southern hemisphere cloud seeding experiment on a grand scale.
It’s not often that such an opportunity arises, so hopefully, there will be a number of meteorological research papers published over the next few years.
Deliberate cloud seeding from planes or UAPs (UFOs are so passe): not so much.
50
Greater Sydney Region water storage dams;
https://www.waternsw.com.au/supply/Greater-Sydney/dams
20
Thanks again Jo
You might be interested in the article linked below:
https://carbon-sense.com/2022/07/04/2021-2022-tonga-volcanic-eruption/
It seems that the mild La Niña may have needed help to produce so much rain!
John
40
Don’t worry, Albo will fix it.
60
The new, all weather, floodproof Windsor Bridge has gone underwater twice now.
60
“Floodproof” – just tickling Mother Nature’s sense of humour
60
She saw it as a challenge.
60
Useful list of flooding dates. Any reference to a listing of events after 1904?
Was in Sidney a few years ago. Went to the opera, of course, in the evening. Towards the end it started to rain. By the time we returned at our lodgings it was bucketing down. Went on the whole night. In the morning the news told over a 100mm of rain had come down in 5 hours. I am from the Low Countries, but never saw something like it.
‘A land of flooding rains’ describes it well.
60
Just as well you weren’t in Sydney in the later 1980’s. There were rain storms as I tried to drive home in peak hour (or as it took me 2hours 10 minutes to do what normally took 20-25 minutes). Driving round all those stalled and abandoned modern vehicles in my old Toyota Corolla was “interesting”.
I’ve forgotten the rainfall but it was very heavy (and I had been in the tropics when 25 mms. fell in 30 minutes). That and the Corolla as I now own my sixth.
30
Flood canals or drainage ways would help. Perhaps massive ones.
The Dutch have lived happily below sea level by means of large construction activity.
60
26% of the Netherlands is below sea level.
40
“The Dutch have lived happily below sea level ”
Well phrased given latest events
50
10
A Chronological Listing of Early Weather Events
20
Hi Everyone
Its time for Australian of the year nominations. Each year we get some clown, how about this year we all nominate Jo Nova for her work on enlightening us.
To Nominate go here https://australianoftheyear.awardsplatform.com/
60
1. Australian of the Year
Joanne Nova (probably should have been Joanne Codling )
Title of the person you are nominating
Mrs ( I hope I got that right )
Is the person you are nominating a co-founder of an organisation?
I don’t know
Are you happy for this nomination to be shared with Australian Honours Secretariat and other state-based Awards programs?
Yes
Contact details of the person you are nominating
What contact details can you provide of the person you are nominating?
Email
What is the email address of the person you are nominating?
[email protected]
How do you know the person you are nominating?
I don’t know them but they’re someone I admire
Select the age group of the person you are nominating
I don’t know nominee’s age (thats not polite)
Is the person you are nominating an Australian citizen?
Yes ( I Hope)
Is the person you are nominating from a culturally or linguistically diverse background?
Not sure
Why are you nominating this person?
Joanne Nova is a very brave lady
Jo Nova is the stage name of Joanne Codling. She took up the name in 1998 for privacy reasons when she started work with Channel Nine as the host of the childrens TV series Y?. Her first full time job at age 22 was as manager of the half million dollar exhibition called the Shell Questacon Science Circus with a team of twelve. She spent five years touring Australia with hands-on science. As an associate lecturer at ANU Joanne helped to develop the Graduate Diploma in Science Communication in its earliest years. She put her favourite hands-on science experiments in the book Serious Science Party Tricks.
Joanne has also managed programs bringing hands-on science to street kids in Melbourne and remote Aboriginal communities as well as earning money as a cartoonist, graphic designer and illustrator. She is into liberty, medical research, money, history, and climate science, as well as anthropology, Austrian economics, and the trajectory of great civilizations.
Joanne now blogs at joannenova.com.au on matters related to science
Please give examples of the nominee’s excellence in their field
https://joannenova.com.au/2022/07/the-long-forgotten-floods-of-windsor-and-sydney/
Describe the nominee’s significant contributions to their local, national and global communities
Joanne’s contributions include very well researched and fact based blog articles on many science related topics. Often she has to challenge the status quo, she does this by provided well researched fact based articles and she actually posts the sources for her research. It is fact based which is very brave these days.
Tell us how the nominee inspires Australians
She is very brave and committed to discussing fact based science. Something that is very rare these days
50
It’s 30years beyond time that when the ABC, the BOM and any other person or organisation that comes out with these predictions of huge doom and gloom about the world’s climate future, that there be a huge demand back at them to identify the persons/organisations behind the prophesies made. Then, those people and organisations have to face direct interrogation by their peers around the science behind the alleged proof of those forecasts.
The anthropogenic global warming theory is now beyond a joke. Nothing at all to do with its climate debacle anymore (‘It’s not going to rain much again and dams wouldn’t fill’. That’s the most obviously wrong and most damaging statement ever made when it comes to the quality of life of people in this country). If we had gone for the most obvious answer to these prognostications that are incapable of handling peer group argument, ie nuclear power generation, we wouldn’t now be in the mess of being forced to endure this piecemeal enforcement of destroying what worked and replacing it with a developmental renewables system that’s incapable of doing its job and waiting for many $1+B batteries that are also incapable of doing the job. That’s what Germany and the EU have declared, now having to find fossil fuels from anywhere to keep their heaters on and factories and people working.
It’s becoming apparent this was never about the climate. That’s the lie upon which the fear campaign could be built. The more people fear the climate the less they are concentrating on the future being constructed for them by the mechanics developed under the guise of saving the planet. There are those ghostly groups intent on pulling down the Western nations to servitude while the rest of the planet sees through the scheme and refuses to participate ie Russia, China, India and Brazil in particular.
The Western nations are forced – by their own governments, unbelievably whether left or right persuasion, to both give away their wealth to other nations (buying ‘permits’ie nothing) and to become increasingly hamstrung (figuratively like footballers) in their ability to produce anything. Again, unbelievably, at the hands of our own manufacturers, billionaires and Industrialists, our politicians considered our potential foe’s nations to be a good place to transfer all western industrial knowledge and wealth. These groups are all ready to feather their own nests by this setup which gives to them enormous wealth and the hope of power beyond imagination in ruling the West itself. They know, and the activists know, they will never control Russia and China and India, but that’s not their aim anyway.
We in the West are now moving like chooks to the slaughter with our necks to be extended over the chopping block. We see in Holland and we see coming here soon under Albo’s government, the final assault against the West by these green extremists (and that’s just the cover story for useful idiots) is on our food supplies. Remember, the Earth is greening under higher CO2 concentrations in the atmosphere. In 50years our crop production has gone from being unable to feed 4billion people to now being able to feed ~8billion. If the world cools as the solar scientists consider probable, we are going to need all the CO2 we can get as CO2 reuptake by cooling oceans occurs. Instead, our farmers are under attack from increasing costs of production, fertiliser tightness, increased taxes on farting ruminants and anything else the activists and George Soros can dream up. Bill Gates is now the largest owner of agricultural land in the USA and is taking it out of farming as I understand.
It is now totally unarguable that these activists have absolutely no interest in the survival of the human race as it is. The Dutch are realising that if nitrogen in the soil is decreed toxic (farmers don’t apply urea for the abundance of nitrogen in our soils; it’s deficient) and there were reports of the crazies in the Dutch parliament demanding the farmers ditch 90% of their ruminants, then the world is in for a mass starvation eventually, as this is just the start. Europe already faces shortage of grains due to the Russian war. Sri Lanka has just worked that no artificial fertiliser system by government decree and it is on the verge of being unable to feed itself. Again, politicians driving this stuff cannot be blind to the evidence of where they lead.
People need to understand the end their political leaders lead them to. Those conclusions are totally on display on the planet. Germany following Merkel’s crazy dreams of big migration, destruction of fossil fuel systems, closures of nuclear plants. All for renewable miracles, but soon to be followed by food shortages and freezing. The lessons of Texas freezing this year after winter was ignored. In Australia our politicians are totally impervious to reason even when the those results are known by the people. Bowen doubles down on renewables to fix the problems created – by renewables. Albo wants to double down on the entire AGW backed theory when he sees the EU and Britain fearing for their futures next winter. This political pretend blindness is worse than a disgrace. It’s deliberate national destruction and they are either totally blind ideologues, unthinking egotistical fools or know it all and carry on regardless. They are unfit for office imo and should be brought before the Courts to defend themselves. The chances of that are zero when one looks at our Courts, the use of political power againstindividuals and the outcomes from some courts these days.i
We thought Democracy and Political Western theory were the leading philosophies of the world. How dumb are we to elect these fools/power addicts. It is now obvious. Even the lives of we people in those democracies don’t matter a damn, and neither do our standards of living when it comes to our governments. We are living one big lie and we tolerate being silenced by these people. The boot should be on the other foot. Look at the fawning, gutless, led by the UN/EU nose leadership of most of the Democracies and tell me we shouldn’t have cleaned most of these politicians out long ago.
40