There’s an electromagnetic ball of fire that is 1.3 million times the size of Earth and just 8 minutes away by photon, and we really don’t know what’s going on there.
Climate models assume the solar wind and magnetic field has no effect on our climate. But we find solar patterns everywhere from the prehistoric climate of Greenland, the North Atlantic jet stream, and even in human fertility and lifespan and jellyfish plagues.
Historians will mock us for trying to predict Earth’s climate when we are in the baby days of Space Weather knowledge. Solar Cycle 24 (the last one) was a shorter cycle, just under 10 years. Right now the big question is whether Solar Cycle 25 will be bigger and more active which seems to happen after a short cycle. But it’s too early to tell. This top graph overstates the effect.
Sunspot Activity on The Sun Is Seriously Exceeding Official Predictions
The Solar Cycle Prediction Panel predicted that the 25th cycle since record-keeping began would be similarly quiet, with a peak of 115 sunspots. By contrast, the number of sunspots for the last 18 months has been consistently higher than predictions. At time of writing, the Sun has 61 sunspots, and we’re still over three years from solar maximum.
Solar Cycle 25, bigger than expected.
Cycle 25 has been consistently higher than Cycle 24, but it is all within the margins of noise.
It certainly doesn’t look like it will be “the highest on record”. h/t Eben.
So there are battles over predictions but they are all guessing, including the author of this press release, and the top graph, Scott McIntosh, who admits as much:
A solar cycle following a longer cycle, they noticed, was likely to be on the weaker side. But a cycle following a shorter cycle was likely to be stronger. Solar Cycle 23 was long, which is consistent with the weakness of Solar Cycle 24. But Solar Cycle 24 was also short, coming in at just under 10 years.
This, McIntosh and his colleagues predicted in 2020, meant that Solar Cycle 25 was likely to be stronger – perhaps among the strongest on record. And the climbing sunspot numbers would suggest they may have been onto something.
“Scientists have struggled to predict both the length and the strength of sunspot cycles because we lack a fundamental understanding of the mechanism that drives the cycle,” McIntosh said at the time.
Though for the solar nerds, McIntosh explained his reasons back in 2020:
If he’s right and extreme UV marks the magnetic fields moving in waves, it’s just one more factor that’s missing in the models. Climate modelers think the Sun is just a ball of light, and fill all the gaps in their understanding with the hypothetical effect of “CO2”.
In 2014, he and his colleagues published a paper describing their observations of the Sun on a 22-year cycle.
This has long been considered the full solar cycle, when the poles return to their starting positions, but McIntosh noticed something interesting. Over the course of about 20 years or so, flickers of extreme ultraviolet light called coronal bright points seem to move from the poles towards the equator, meeting in the middle.
The movement of these bright points across the mid-latitudes seems to coincide with sunspot activity.
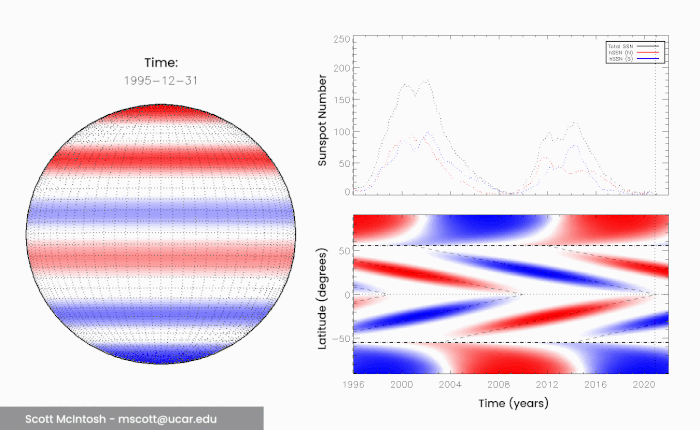
It’s really more of a 22 year cycle on the sun before the North pole gets back to where it started.
These bright points, McIntosh believes, are linked with bands of magnetic fields that wrap around the Sun, propagating from the poles to the equator every 11 years or so.
Because they have opposite polarity, when they meet in the middle, they cancel each other out – what the researchers call a “terminator”. These terminator events mark the end of a solar magnetic cycle, and the start of the next.
But they don’t always take exactly the same amount of time. Sometimes these bands slow down as they reach mid-latitudes, which means that the length of time between terminator events varies. And the team noticed that there’s a correlation between the length of time between terminators and the intensity of the following solar maximum.
“When we look back over the 270-year long observational record of terminator events, we see that the longer the time between terminators, the weaker the next cycle,” said astronomer Bob Leamon of the University of Maryland Baltimore County.
“And, conversely, the shorter the time between terminators, the stronger the next solar cycle is.”
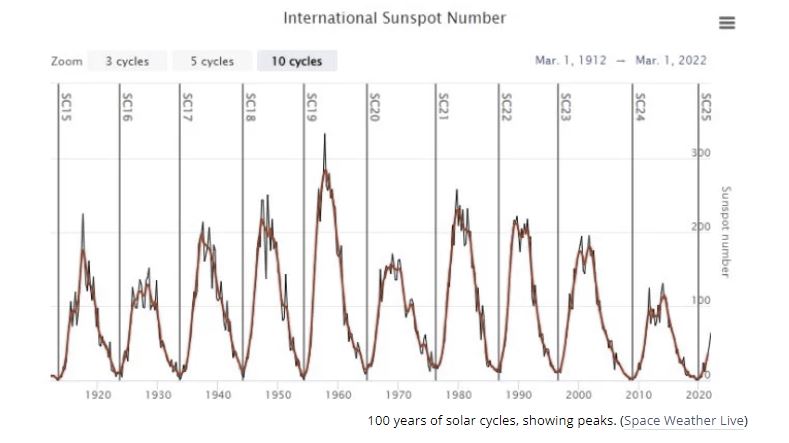
100 years of solar cycles, showing peaks. (Space Weather Live)
These solar cycles we don’t understand leave a mark on Earth’s atmospheric pressure, the Central European floods, wind and rain in Chile, Australia and Asia and even in the groundwater recharge rate in China. Maybe that matters?


With the current ramping up of the cycle 25 and possible terminator event occurrence there is a lot of buzzing and claims that the cycle 25 is significantly stronger than the predictions of low cycle similar to 24. These claims are made by both amateur enthusiasts but surprisingly by prominent professionals as well.
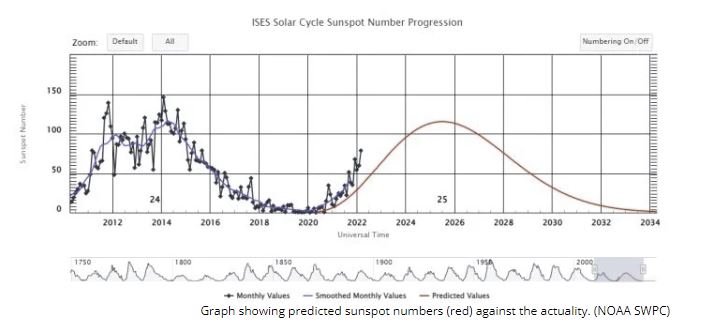
they are accompanied by charts like this as the evidence.
https://i.postimg.cc/Fszh0KWq/ises-solar-cycle-sunspot.png
This is not only wrong but just plain stupid. The predictions in these charts are just a general depiction of the C25 duration and the maximum peak reduced to a simple smooth hump like curve. It should be totally obvious the curve itself is not to be followed as an exact prediction as no cycle actually even looks like this.
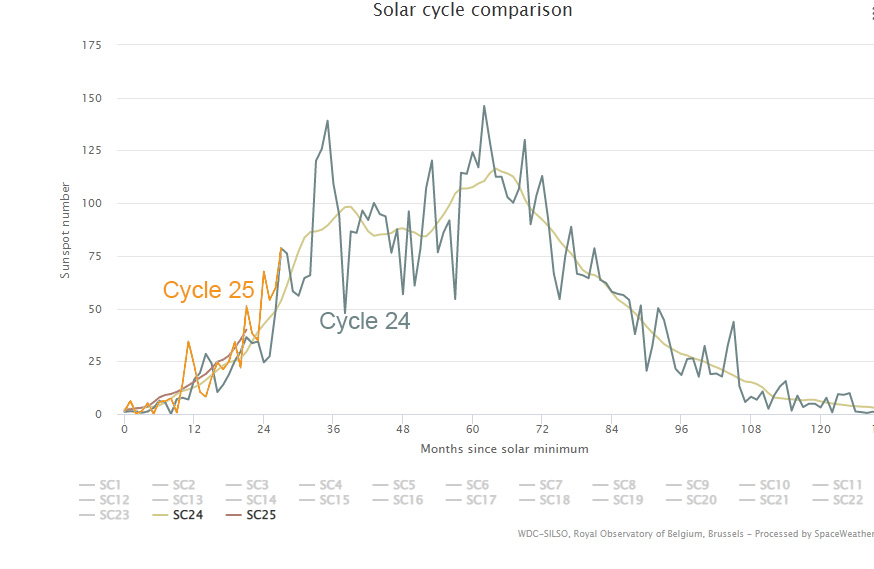
If you want to see how the progression and the ramp up rate really stands you have to stack up the actual cycles against it, like this.
https://i.postimg.cc/4x9H4vsX/msolar-cycle-comparison.jpg
There you can see the C25 is clearly following C24 so far, even though that is no prove of where it is going to end up in it’s peak.
100
Eben, If the experts predictions are only a smoothed symmetrical curve based on a bad guess, that’s my point. We don’t understand the solar cycles.
But I take your point that the latest SILSO numbersof 75 might be noise. We don’t understand why the first half of Cycle 24 also rose so fast then leveled off. I’ve tweaked the headline — thanks — lest “twice” conveys a numerical meaning that isn’t worthy. The ISES curve still looks “off”.
212
I added your graph Eben plus a lot more to the post — thank you. Clearly its too soon to call — this is a press release battle between two solar camps and none of them know. PS: I would have sent you an email, but I suspect it won’t get there…
252
Thanks for all your work Jo. It is much appreciated.
80
I’m not quite sure that SSN on a given day can become noise just because a commenter suggests you it might be.
Here is a daily output of the solar flux at 10.7 cm comparing the superposed SC24 and SC25:
https://i.postimg.cc/13NZKYjs/Solar-flux-F10-monthly-SC25-vs-SC24.png
12
Source
ftp://ftp.seismo.nrcan.gc.ca/spaceweather/solar_flux/daily_flux_values/fluxtable.txt
12
In case it might not be quite clear how SSN and F107 correlate: below is a chart I made years ago, comparing them using a uniform percent scaling due to their differing value range:
https://drive.google.com/file/d/1ShXgzae4Fr_fOs9kWJiSzD8yXkcewQZY/view
Sources
SILSO Sun Spot number monthly
LISIRD F10.7 cm monthly
22
Jo, many may not have heard of Miles Mathis see here for his many articles http://milesmathis.com/updates.html . Miles has worked out solar cycles using planet alignments. This article refers to sunspot cycle 25 “NEW PAPER, added 1/9/22, Solar Cycle 25 is Strong. My prediction continues to come true”. This was an earlier paper “NEW PAPER, added 12/1/20, Solar Cycles: Miles v. the Mainstream. My Dutch collaborator Steven Oostdijk has written a long paper comparing my predictions to the mainstream’s. In short, the current hard spike in numbers coinciding with the Jupiter-Saturn conjunction is a body blow to current dynamo theory. It confirms my charge models with huge exclamation points”.
In Miles’s papers there is reference to a website which allows a look at planet alignments for any year (forward or back) It gives an interesting perspective.
70
Thanks Cementafriend!
20
Thank you Joanne, I hope I always make sensible comments on topic.
Here is the web site on the planet motions https://www.fourmilab.ch/cgi-bin/Solar. I had thought the planet alignment last July could cause something like severe El Nino and volcanic action. Some say the Hunga Tonga undersea volcano was in part responsible for the recent heavy rainfall in SE Queensland and Eastern NSW
40
So C25 is in line with the weak C24 so far, and the predictions that C25 will be stronger seem to depend on it being longer. How fast are the UV coronal bright points moving in C25 compared with earlier cycles? That would appear to be a meaningful clue.
10
I suspect that we won’t really know the outcome of sc25 for another 10 to 12 years, and even then we will probably not understand fully just why that outcome is what it is.
50
Thanks, Joanne! Even the solar sociopaths must acknowledge that at the ratio of 1.3 million to 1 there is little we Earthlings can do to affect the sun’s influence on us! Let’s just enjoy the ride for the next several million years! Install solar panels if you like but, governments, please stop subsidising them.
260
Ben Davidson is arguably the Einstein of our time in the solar physics arena – https://www.youtube.com/user/Suspicious0bservers
22
Thanks for the link Cardimona. I became interested in the sun/planets link after reading this Fairbridge and Shirley 1987 paper on solar inertial motion and prolonged solar minimums. Their work was purely gravitational, based on the motion of the sun around the barycentre in response to Jovian planetary motion, but the linking of magnetic field interactions as well is compelling.
BTW, Rhodes Fairbridge was a proud West Australian!
30
Be careful with this guy. He’s a lawyer, and he can talk, but he has been taken down pretty spectacularly. Check out…
https://www.youtube.com/watch?v=3fTLZTEE7mU
21
I have always found it remarkable that solar output is always ignored by warmist catastrophists. It is surely by far the most influential affect on earth weather and climate.
The idea that a planet can be terraformed, as warmists are attempting to do with controlling CO2 is strictly a science fiction fantasy.
From Wikipedia, this is about the first science fiction usage of the term “terraform”.
20
Its fairly clear, according to the experts, that CO2 is the major driver of earthly climate.
‘Scientists agree that the solar cycle and its associated short-term changes in irradiance cannot be the main force driving the changes in Earth’s climate we are currently seeing. For one thing, the Sun’s energy output only changes by up to 0.15% over the course of the cycle, less than what would be needed to force the change in climate that we see. Also, scientists have not been able to find convincing evidence that the 11-yr cycle is mirrored in any aspects of the climate beyond the stratosphere – such as surface temperature, rainfall or wind patterns.’ (NASA)
So lets talk about the stratosphere.
015
This is the opposing argument.
https://link.springer.com/chapter/10.1007/978-3-540-46315-3_18
00
” Its fairly clear ,according to the experts , that CO2 is the major driver of earthly climate ”
Not according to glaciological research which has shown CO2 increases lagged temperature rises in the order of millennia concerning each of the past four inter-glacial epochs. Atmospheric CO2 increases did not trigger those Pleistocene warming interstadials Nor the Holocene Euan Mearns noted that at the “onset of the last glaciation the time lag was 8000 years and the world was cast into the depths of an ice age with CO2 variance evidently contributing little to the large fall in temperature ” https://euanmearns.com/the-vostok-ice-core-and-the-14000-year-co2-time-lag/
In the 14th century sometime between 1330 – 1350 an estimated 45GT of carbon – equivalent to 6% of the Earths living biomass – was released into the atmosphere [ the blip can be seen in the Law Dome ice core chronology ] and yet northern and southern hemisphere temperatures at the advent of the Little Ice Age did not experience a warming recovery.
12 years ago NASA’s website featured a bulletin titled ” What Are The Primary Forcing’s Of The Earth System “? with the following text : ” The Sun is primary forcing of Earths climate system .Sunlight warms our world ….the Sun drives almost every aspect of our worlds climate system and makes possible life as we know it ……Other important forcing’s of Earths climate system include such variables as clouds ,airborne particulate matter and surface brightness. Each of these varying features of Earths environment has the capacity to exceed the warming influence of greenhouse gases and cause our world to cool ” So the experts at NASA were adamant the Sun was the force majeure of the Earths climate
Then in 2011 the NASA page disappeared down an ‘archived’ memory hole https://americanthinker.com/blog/2011/01/nasas_muzzle_hustle.html
80
Except that CO2 has absolutely zero measurable effect on Earth’s climate.
120
“… according to the experts …”
Hahahaha!
Did you know that 97% of all “experts” agree with the people who pay their wages?
170
So we are agreed, CO2 doesn’t cause global warming and NASA is wrong.
The meandering jet stream and QBO seem to be implicated.
31
Was NASA ‘wrong’ 12 years ago ?…..Your original argument was ” CO2 is the major driver of earthly climate ” Absolutely ridiculous ] Now you have greasily moved the goalposts to ” So we are agreed CO2 doesn’t cause global warming “
30
‘Now you have greasily moved the goalposts …’
Not really, NASA scientists now believe, because of undue pressure, that the sun is not what it used to be.
Nobody really knows the mechanisms involved, we can point to the NAO, ENSO, QBO and PDO.
11
Of course you moved the goalposts ..You are damned by your own disparate statements and now you are attempting to blur and bluff by ‘pointing’ to a few distractive acronyms .The 2010 NASA page was memory holed by NASA – a month or so after the American Thinker blog article – because it did not reinforce anthropogenic global warming ideology.. Carbon dioxide increases lag temperature rises by thousands of years in the paleo-climatic record and NASA admitted in 2010 that cloud cover , albedo and particulate density in the atmosphere can exceed the influence of greenhouse gases.
01
‘Of course you moved the goalposts … ‘
You only walked in off the street and know close to zip. Please tell the rest of the class the mechanisms involved in global cooling?
01
Keep digging ….Its amusing
00
” Its fairly clear ,according to the experts that CO2 is the major driver of earthly climate ” …
.Followed by the doublethink : ” Nobody really knows the mechanisms involved” …C02 is not the major climatic forcing mechanism after you insisted it is ?
00
The amusement is mine, I was being ironic from the get go.
10
I’ll put this up to give everyone a chance to see the light of day.
https://judithcurry.com/2019/09/01/enso-predictions-based-on-solar-activity/
00
Interesting EG. What’s the duration of the obliquely cycle?
10
Could you enlarge upon that question?
00
” I was being ironic from the get go ” …..Yes I do recall you identifying ‘ water vapor as the most potent GHG ” [ February 2019 ] Perhaps you enjoy gaslighting ….For the record the mechanisms involved in global cooling cycles are reasonably well understood …..Just as the Younger Dryas Impact Hypothesis is now essentially confirmed ..Not a mega volcano
10
The impact hypothesis is very appealing, but others think it was a drop in solar activity.
https://www.researchgate.net/publication/222671086_Reduced_solar_activity_as_a_trigger_for_the_start_of_the_Younger_Dryas
I don’t believe the story that the Atlantic conveyor belt broke down because of a large freshwater influx.
00
The other thing worth noting, the Younger Dryas cooling was not evident in Australia, while the Antarctic Cold Reversal has a strong signal. Perhaps its a bipolar seesaw.
https://www.sciencedirect.com/science/article/abs/pii/S1040618212000109
Whatever the cause, it began in the Northern Hemisphere.
00
Knew I should have checked the spelling EG. The Obliquity curve on the first graph, I believe is from earth’s long-term obliquity cycle.
10
There seems to be a paucity of ‘reply’ functions under each and every post …….
“The impact hypothesis is very appealing but others think it was a drop in solar activity ……….” The other thing worth noting , the Younger Dryas cooling was not evident in Australia”…..I ‘don’t believe the story that the Atlantic conveyor belt broke down “…..
What you believe – your opinions – are irrelevant . The surfeit of geochemical evidence in support of the YD extraterrestrial impact hypothesis is overwhelming ……..The case is proven : ” Premature Rejection in Science : The Case of The Younger Dryas Impact Hypothesis , J.L Powell , Science Progress , 2022 , Vol 105 . https://cosmictusk.com/premature-rejection-science-case-younger-dryas-impact-hypothesis/
Time for an update Jo ?
00
Not so fast, here they pour cold water on the impact theory.
https://pubs.geoscienceworld.org/gsa/geology/article/38/4/383/130267/What-Caused-the-Younger-Dryas-Cold-Event
00
The Bolling-Alerod was an interstadial and the Younger Dryas was a stadial. The impact hypothesis is surplus to requirement, but solar forcing is still in the running.
https://en.wikipedia.org/wiki/Bølling–Allerød_warming#/media/File:Evolution_of_temperature_in_the_Post-Glacial_period_according_to_Greenland_ice_cores_(Bølling-Allerød).jpg
00
Obsolete ..Not in the running at all ….Solar forcing does not generate massive biomass burning and the distinctive range of impact proxies at the start of the Younger Dryas I wonder what your oppositional fixation is with denying the confirmation of the YDIH ?
Purely ideological it would seem …The next logical question is why is the mainstream media not covering this story that threatens to overshadow global warming alarmism and all those wasted trillions of dollars ?
00
‘Purely ideological it would seem …’
Not at all, I have always supported the impact hypothesis, but lately I’m thinking a combo of effects came into play at roughly the same time. A quiet sun altered the atmosphere and a large cosmic impact made it worse, then there is this internal dynamic, the binge of the Bolling-Allerod leads to the purge of the Younger Dryas.
00
If you scroll down to the Criticism you can see the problems to be resolved.
https://en.wikipedia.org/wiki/Younger_Dryas_impact_hypothesis#Criticism
00
Its fairly clear, according to Maxwell, Planck and Einstein, that the Sun is the major driver of earthly climate.
The only true way to validate the Arrhenius Hypothesis for the Earth would be to compare assumptions with Venus. The Earth and Venus are of similar size. The Earth has a 0.0413 percent carbon dioxide atmosphere. But Venus has a 96.5 percent carbon dioxide atmosphere, the other 3.5 percent is Nitrogen, but the 78 percent Nitrogen on Earth is not regarded as a greenhouse gas by the man made climate change dogma. It is known from NASA data that the temperature on Venus at the altitude that has identical pressure to that on the Earth’s surface is 1.176 times the Earth’s average surface temperature. The radiating temperature of Venus is 1.176 times that of the Earth, proving that input from the Sun and a change to thermal inertia due to pressure as a precise function of altitude are all that is needed to calculate the atmospheric greenhouse effect on Venus.
The “Unified Theory of Climate” proves itself using NASA data at the surface of the Earth, Europa, Mars, Titan, Triton and Venus. And NASA data also matches the “Theory” at the one bar pressure points of the Earth, Jupiter, Neptune, Saturn, Titan, Uranus and Venus. It can also be used to fit pressures that are less than the surface pressure of each planet, in the troposphere, not just one bar, but also 500 millibars. Overwhelming proof for a theory based on Atmospheric mass, gravity and air pressure first suggested by James Clerk Maxwell in 1871, with an explanation for planetary temperatures based on a testable body of evidence that has been repeatedly confirmed through observation.
This also proves Max Planck’s suggestion that radiative forcing is “Rubbish”. In 1906 Planck used Einstein’s mass–energy equivalence formula to determine that the energy is converted into mass not heat. The vibrations towards and away from the radiation add up to zero, but the radiation is travelling at the speed of light, so a bit of energy is absorbed as mass. Still to this day, it has never been shown by experiment, a cornerstone of the scientific method, that greenhouse gases absorbing infrared energy can physically cause observed warming. The NASA data for the Unified Theory of Climate, proves that Maxwell, Planck and Einstein were correct, and that Svante Arrhenius was incorrect in thinking that radiation is converted into heat.
30
Net radiative transfers in an atmosphere are governed by temperature difference..
In an atmosphere, those temperature difference are governed by the gravity based thermal gradient.
The only effect of increased atmospheric CO2 is going to be increased plant growth.
10
Facts extracted from scientific papers found on Google Scholar: In calibrating Carbon Dioxide Warming by molar mass, how much does Carbon Dioxide contribute to the Greenhouse effect. The Answer is this: Nitrogen is the main Greenhouse gas at 100.6 Kelvin and Oxygen imparts 30.3 Kelvin. Argon is third accounting for 1.7 Kelvin, and Water vapour is fourth accounting for 0.3 Kelvin. Carbon Dioxide only produces 0.0532 Kelvin by molar mass. But then isotopic evidence says that only a maximum of four percent of CO2 in the Atmosphere could be man-made plus volcanic. That was differentiated as 10ppm for Volcanic and 6ppm for Man-made CO2. So therefore in two hundred years, man-made CO2 has contributed only 0.000798 Kelvin to Global Warming. The missing man-made contribution from emissions must have been absorbed by the Oceans, which have a mass 275 times that of the Atmosphere. Its slightly above 400ppm, so Man-made carbon dioxide has contributed eight ten thousandths of a degree Kelvin to Global Warming.
40
Except that nitrogen is not a greenhouse gas. It does not absorb IR.
Do your own research they said.
03
Not the point. As Happer has stated, the non-radiative atmospheric gases “steal” the energy away from the CO2 molecules before the molecules have a chance to re-radiate the energy. Do you own research.
20
Should I know Happer? How is this stealing achieved and what is this energy that they steal?
03
It’s definitely worthwhile researching Prof William Happer’s papers, particularly his recent co-authored one with William Wijngaarden, as he is regarded as one of the world’s leading experts on the behaviour of atmospheric gases. He points out that 99.9999999% of CO2’s absorbed IR is converted by molecular collisions into heat. So the oft-repeated assertion that GHG molecules re-radiate IR photons only applies to one photon in about a billion. There was a detailed discussion on this subject in January 2015.
60
So, Nitrogen doesn’t absorb radiation, doesn’t it. 😉
and
“
00
IR Andy
10
?? You have lost it. Peter?
Are you saying that if you irradiate nitrogen with IR, it won’t get warmer ?
WOW !!
01
Confused and with an IQ of 164, I found the solution from reading about Max Planck’s take on the issue: So we have evidence that radiative heating & gravitational heating do not occur for the same reason. The reason being that the random nature of the movement of molecules means half of the molecules moving towards the radiation or away from the gravity field, are slowed down or cooled. So then radiative forcing or gravitational forcing is real, but only positive for half of the molecules. So in reality no heat is created in this process. So Nitrogen is the main Greenhouse gas at 100.6 Kelvin, by molar mass, not by radiative forcing. So the made up term “Gravitational Greenhouse Effect” would refer to a “Pressure-induced Thermal Inertia” not “Gravitational Forcing”.
Prof William Happer like most scientists make the basic mistake of taking an assumption as a fact. The simplest way of proving that “Pressure-induced Thermal Inertia” is true, and not “Radiative Warming”, is the fact that the average temperature at the one bar pressure points on each of the planets, is the same, adjusted for distance from the Sun, despite the different main gases, Nitrogen for the Earth & Titan, Hydrogen for Jupiter, Neptune, Saturn & Uranus and Carbon Dioxide for Venus.
Simples!
00
what a coincidence
02
Another “nothing” comment…
Don’t you know anything about basic atmospheric physics? No argument to put?
Do you deny that there is gravity based and controlled thermal gradient?
Do you deny basic radiative transfer laws?
00
Not knowing who Happer was should provide a clue…
10
Or clueless ! 😉
00
The comparison to the lower SWPC SC25 prediction makes the current cycle look ‘strong’, but this solar cycle is still just slightly ahead of SC24, and looks to remain so.
The problem for McIntosh, Leamon et al is their forecast is already busted because in 2020 they anticipated an earlier terminator, mid-2020, which didn’t happen then, than the actual one they eventually declared for December 2021, 18 months overdue. They were counting on a shorter cycle SC24 for their big SC25 prediction, when in fact SC24 was exactly of average length.
-my bold
Their mechanism works, as sunspots did swell in numbers after the actual terminator in December 2021. Predicting when is another thing…
01
Science. Yum, yum!
00
Meme of the Day #33
20
Canada: The Federal Climate Plan – Far Out of Touch with The World, With First Nations, with Its Regions, and The Feds Just Don’t Care
People have been asking for thoughts on the recently announced federal climate plan. I shrug. I ask them what their thoughts are on the Iowa State Fair Hog Calling Regulations. I am indifferent.
I know I should care, but what’s the point? The feds throw something at us, we have to work with it. We can’t “assume a leadership role”, because they don’t want hydrocarbon players in the room. The hydrocarbon industry is working flat out on CCUS, hydrogen, RNG, you name it, but that is all beside the point, when the industry must be decimated for the greater good.
The best way to explain is with two buckets of quotes:
20
Probably not. Sunspot number and “number of sunspots” are very different things The 61 number is almost certainly(I haven’t checked) ‘sunspot number’.
https://www.astroleague.org/content/what%E2%80%99s-sunspot-number
In science, details matter.
30
Been a long time since I followed and consumed the solar cycle crowd’s videos – Oppenheimer ranch project and Dave at Adapt 2030. All I remember is some Ukranian astro scientist, woman, saying in 2017 that by 2024 we should be getting some very cold winters and we are quite confident of that. Getting close now. I like checking on people’s predictions.
I find those guys interesting but a little doomsayer for me. They have been predicting food shortages since I was watching them around 2015, and looks like we are headed to that, but not sure for the same reason they stipulate of long cold winters. Ag grain harvest in Australia I would dare say is in for a couple of record breaking years ahead. I have never seen conditions so good.
[Caught in the spam filter. Sorry! – Jo]
00
“the big question is whether Solar Cycle 25 will be bigger and more active”
We know that, if it is bigger and more active, it’s because of Man Made CO2.
41
No, we don’t know that.
00
Using the physics of a Plasma Universe (PU) model it becomes possible to understand the phenomenon. Source.
12
Been a pretty active week for our Sun. A Cannibal CME and an X-class solar flare and just today a G3 event.
Have you listened to the Sun lately? 🙂
http://solar-center.stanford.edu/heliopage.html
00
You all are missing the big news. The solar cycle is failing. What is happening now is the same as what happened when the Maunder minimum occurred. The cycle before the Maunder minimum failed during the cycle. The sunspot counting is fake.
There are not 61 visible sunspots on the sun today.
https://sdo.gsfc.nasa.gov/assets/img/latest/latest_1024_HMIIC.jpg
There is perhaps one or two visual sunspots. The sunspots that are observed are however tiny pores, not sunspots. Sunspot groups, prior to the change in the sun, had a lifetime of 22 days. Sunspots groups now have an average life of less than 10 days. Some have a lifetime of a couple of days.
Sun spots form from magnetic flux that rises up from the solar tachocline which is the region of the sun were it is believed the magnetic flux forms.
Something changed during solar cycle 23/24 and the magnetic field strength of newly formed sunspots started to decline. The magnetic field that rises up from tachocline requires a field strength of 20k to 30k gauss to resist being torn apart by the convection motion in the solar convection zone before the magnetic flux reaches the surface to form a sunspot.
https://www.swsc-journal.org/articles/swsc/full_html/2012/01/swsc120019/swsc120019.html
Are the sunspots really vanishing?
Anomalies in solar cycle 23 and implications for long-term models and proxies
https://arxiv.org/abs/1705.09099v1
The Sun in transition? Persistence of near-surface structural changes through Cycle 24
The peculiar solar cycle 24 – where do we stand?
http://iopscience.iop.org/1742-6596/440/1/012001/pdf/1742-6596_440_1_012001.pdf
The sunspot ‘number’ now is not representative of the magnetic field activity on the sun.
When the sunspots started to disappear during solar cycle 24 the start of fake (a new non-visual method of ‘counting’) sunspot counting started.
Sunspots are dark because the strong magnetic fields. When the magnetic field of individual sunspots and the total sunspot group started to weaken… It was no long possible to visually see most sunspots.
50
The general public and most of the scientific community are clueless that the solar cycle is failing because there was a change to fake sunspot counting to hide the change in the solar cycle.
I.e. If the sunspots were counted using the same visual method that was used for the last 20 years, to count sunspots, the sunspot count would be reduced, by roughly 50% at the start of solar cycle 25 and would be reduced by roughly 80% now.
This is a link to Jan Alvestad’s, excellent solar site. Alvestad no longer displays a visual picture of the sun because the sunspots can no longer be seen. What is displayed is a picture that is created using the Zeeman effect to see magnetic field differences on the surface of the sun. The colored regions have higher magnetic field strength.
S7484 and S7481 are regions where the magnetic flux tubes have risen, leaving a region on the surface of the sun where there is higher magnetic field strength and no sunspots. These failed sunspot groups started to appear during solar cycle 24.
Sunspot groups 12985 and 12987 have lost all of their sunspots. There is just a region on the sun that has magnetic flux.
http://www.solen.info/solar/
https://sdo.gsfc.nasa.gov/assets/img/latest/latest_1024_HMIIC.jpg
This paper that was published in 2012 discusses the shrinking of sunspots.
The ‘small’ sunspots are not sunspots. The tiny (the current sunspots are tiny, not small as compared to normal sunspots) are the residue that forms when the magnetic flux tubes are torn apart by convection forces in the sun.
https://iopscience.iop.org/article/10.1088/2041-8205/758/1/L20/meta
ON A POSSIBLE EXPLANATION OF THE LONG-TERM DECREASE IN SUNSPOT FIELD STRENGTH
“Finally, we show that during the period of 1998–2011, the number of large sunspots gradually decreased, while the number of small sunspots steadily increased.
We suggest that this change in the fraction of small and large sunspots (perhaps, due to changes in the solar dynamo) can explain the gradual decline in average sunspot field strength as observed by Penn & Livingston.”
https://iopscience.iop.org/article/10.3847/1538-4357/833/1/94/pdf
ON THE PRESENCE OF TWO POPULATIONS OF SUNSPOTS
50
Here they are looking at distant stars for cycles. They have found one that is behaving like ours during the Maunder Minimum.
https://www.psu.edu/news/eberly-college-science/story/nearby-star-could-help-explain-why-our-sun-didnt-have-sunspots-70/
00
Thanks for the link to the discovery of a sunlike star that has been caught in the change from magnetically active to a Maunder minimum state.
Solar cycle 25 is failing which explains why there are so many new papers discussing the failure of the solar magnetic cycle. For those who are unaware the sun is producing weaker and weaker magnetic flux tubes. The magnetic flux tubes float up to the surface of the sun to form sunspots. The magnetic flux tubes require a minimum field strength to avoid being torn apart by the motion in the solar convection zone.
Sunspots in prior cycles were large, visual, and long lived (22 days average). As can be seen there are now no visual sunspots on the sun. The sunspot counting is fake as it is hiding what is happening to sun.
https://sdo.gsfc.nasa.gov/assets/img/latest/latest_1024_HMIIC.jpg
There are today six regions of the sun that have failed sunspot groups. This is what forms when the magnetic flux tubes are torn apart and most of the magnetic field cancels and is lost.
http://www.solen.info/solar/
S7479, S7481, S7483, S7484, S7487, S7488
There are two sunspots groups 12983 and 12985 that had tiny sunspots and a few days later now do not have visual sunspots. These sunspots groups were formed from magnetic flux tubes that were slightly stronger than the S series.
Sunlike stars (same/similar size, composition, temperature, and age as the sun) as they age, lose rotational energy and stop produce a strong magnetic field. The sun is at the age where it is transitioning between the two states. The solar large-scale magnetic field is created from the residue of the magnetic field from sunspots. If there are no sunspots for years the large-scale magnetic field becomes weaker and weaker.
https://academic.oup.com/mnrasl/article/506/1/L50/6324494
Stellar mid-life crisis: subcritical magnetic dynamos of solar-like stars and the breakdown of gyrochronology
https://www.sciencedaily.com/releases/2021/07/210728105700.htm
Magnetic fields implicated in the mysterious midlife crisis of stars
30
Interesting link EG.
20
[…] Experts Adrift: Solar Cycle 25 more active than expected […]
00