What’s the definition of The Greatest Global Pushover in the world? How about the nation that is often the worlds top exporter of coal and fifth biggest for gas, with the biggest distances, the lowest population density, fastest population growth, in a land where electricity prices have doubled, but which has already cut emissions by a staggering 46% each while adding more renewable energy per capita than any nation on Earth. Yet we worry about being “left behind” or called a pariah?
To double the Patsy-points, we’re an agricultural nation spending billions reducing emissions of a plant fertilizer that boosts yields and crops and makes plants more drought tolerant. Droughts aren’t getting worse (the Professors agree). Our worst drought was 100 years ago, or more likely 1,000. The worst fires were 4000 years ago. We reached 50 degrees Celsius in most states of Australia in the 1800s. Our rainfall trend is up. Our sea levels have dropped by two meters in the last 5,000 years, and the Great Barrier Reef survived just fine. The truth is that carbon is a net benefit, we’re a high energy, long distance, rapidly growing remote nation that’s already done far too much.
The hard numbers: Australian emissions have been cut 46% per capita, while the population grew 50% larger and the GDP grew 135%.
Scott Morrison might be the worst negotiator on Earth. He failed to explain our achievements, to defend Australian workers, farmers and households and the voters who voted for him, to reach a deal that’s remotely fair. Teenage girls are gaslighting him. Bullies who serve bankers, greens and China pretend that Australians past carbon dioxide reductions don’t count because we achieved them by Land Use and Forestry. Lordy — Australians grew trees. The travesty! It only shows that the carbon game has nothing to do with the environment and nothing to do with carbon dioxide either. Do megatons of CO2 matter or don’t they?
Since 1990 — Every Australian has cut CO2 emissions by 46%
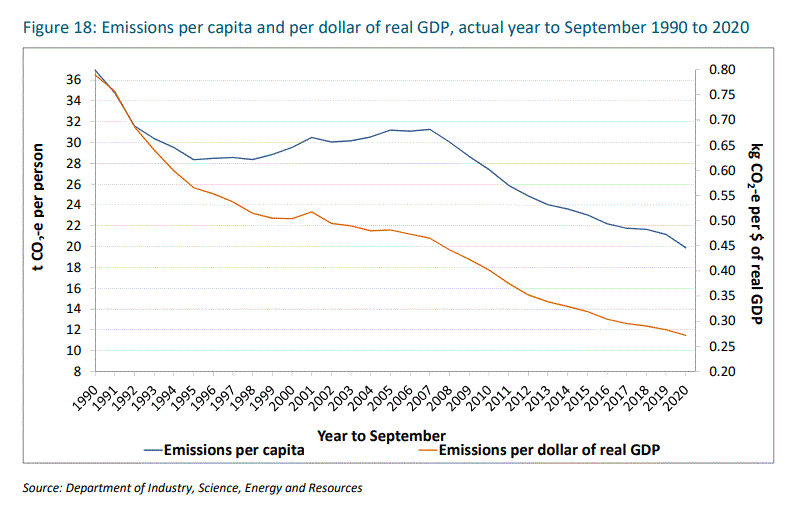
Emissions per capita (grey line) are exceptional, but emissions per GDP dollar (orange line) are even better. Blakers, A., Stocks, M., and Lu, B. (2019) Australia: the renewable energy superstar, APO Analysis and Policy Observatory, ANU, [PDF]
Australia installs more renewables than anywhere else per capita
Morrison and co are not even using the Blakers et al graph below. In 2018 and 2019 Australians were installing renewable energy, faster than any place on Earth. Why don’t Australians know this?

Per capita, Australia (all shades of red) blitzed the field for installing renewables
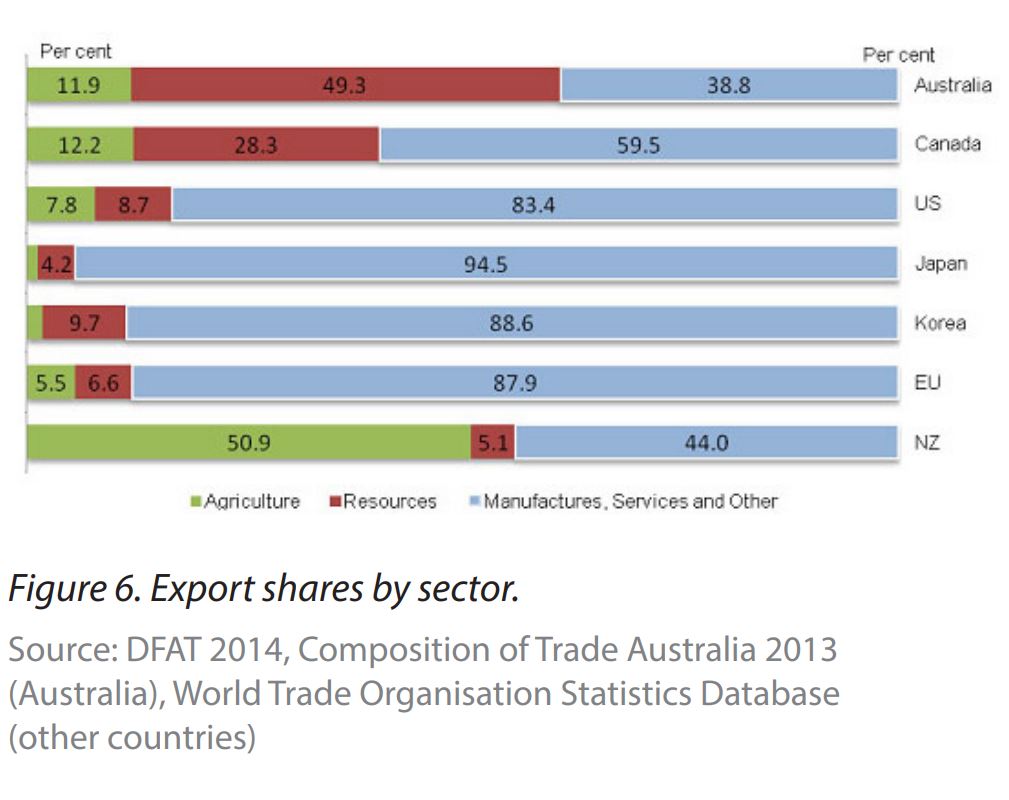
Australia is more dependent on mining and resources than most other developed nations:
Fully fifty percent of Australian exports are from mining. These are the most energy intensive exports on Earth, and the world needs these resources. Someone has to dig them up somewhere around the world, yet Australians’ get lumbered with all the emissions accrued in getting these minerals out of the ground? We’ve shifted some of our Aluminium smelters overseas, and to what end? Their smelters are less efficient, carbon emissions have increased, Australian jobs and profits have gone. Who benefits from the rigged carbon shell game? Our competitors.
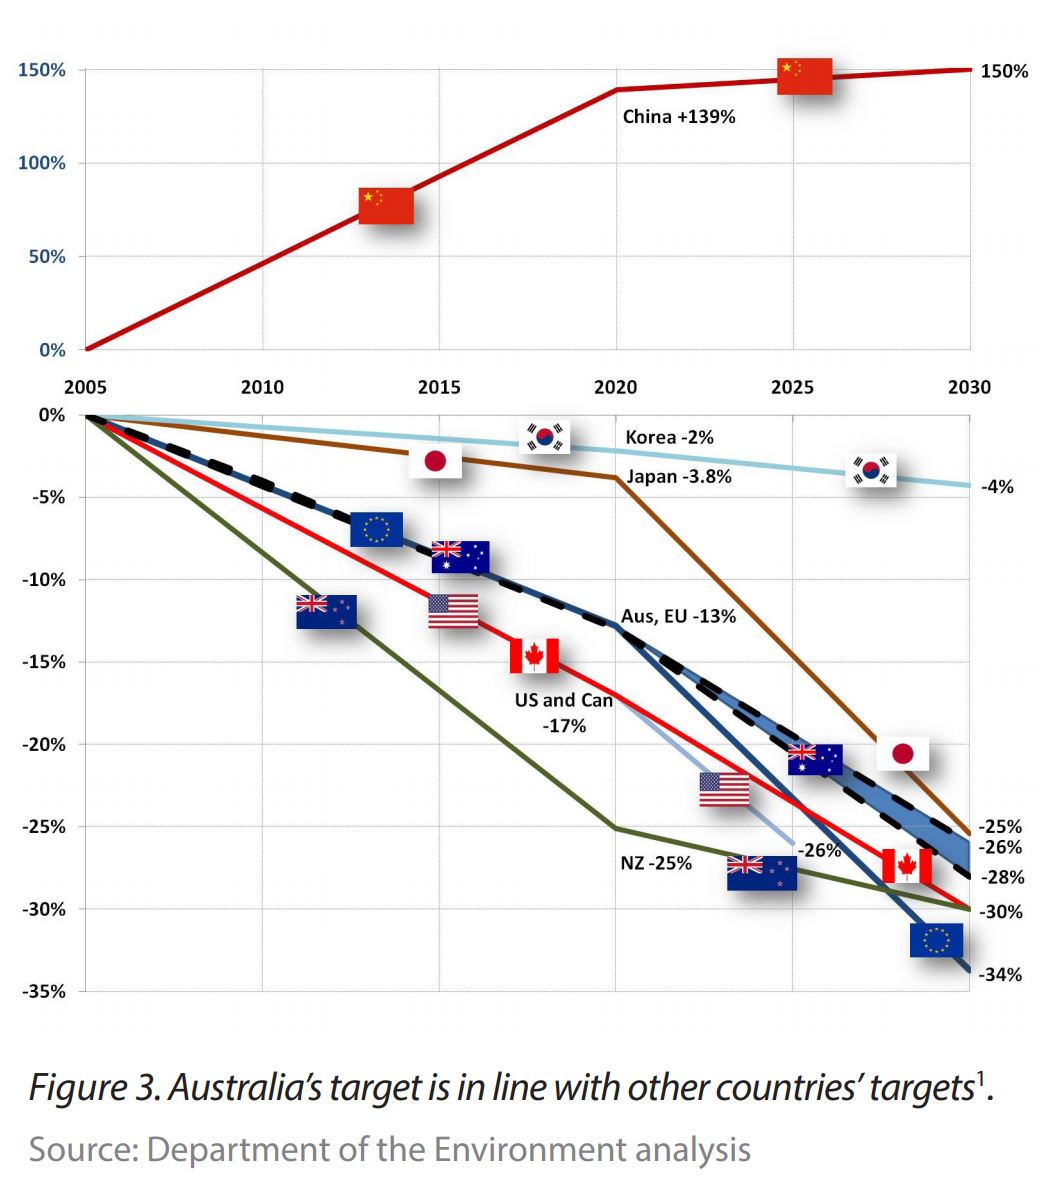
Australia is not falling behind even by the normal EU-biased way of accounting
The idea that Australia lags behind is a nonsense-stick to beat good people with. The usual way of comparing emissions reductions is per country, not per capita. This suits the EU. Even so Australia has set a similar target compared to everywhere else, which only goes to show how bad our negotiators were. A long time ago, in the first Kyoto agreement John Howard’s team negotiated an 8% increase in emissions for Australia which made some allowance for our rapidly growing population, distances, and energy dependent export industries. Since then, Australian politicians have only managed to weekly, meekly, “join the pack” at our great disadvantage, and at the same time get harangued for not doing even more.
Australians have cut emissions by 46% each, added more renewables per capita than anywhere on Earth, all without Net Zero.
The net cost of Net Zero includes all the glorious subsidies, the extra transmission lines, the rising FCAS bill, the blackouts, the emergency demand management, the damage from surging voltages, the wasted capital expenditure, the squads of flying diesels, synchronous condensors, and the burden that unreliable energy dumps on the whole grid. In the US windpower makes gas power $30/MWh more expensive, — the intermittent generators are vandals on the system, destroying productivity and profits of the good generators.
Coal gave us 30 years of falling prices, and renewables wiped all those gains out.
REFERENCES
Australia’s 2030 Emission Reduction Target
Nations with some of the most expensive electricity in the world