PRE NOTE: Obviously Australian emissions of free aerial fertilizer are a net benefit to the world, and we should be paid for them, not charged. But in this world of witchcraft, and lacking a billionaire celebrity who can win elections and face down the media mob — this post is about the obvious, immediately doable ways to reduce the burden of being the worlds Global Patsy. Read it in that spirit. Even within a game with stupid rules, it’s time to go on the attack..
Suddenly the Australian government uses the magic term “Per Capita” and baffles the commentariat
While the rest of the world revels in their glorious fantasy future carbon “targets” the Australian government has finally realized that the measurement units “per country” suited the European overlords, and it was time to reframe the debate.
I have been saying for years, years and years, that Australia has been the Star Global Patsy, doing more per capita than any other nation despite being the fastest growing, furthest, remotest, sparsest and most dependent economy on coal. This is despite most nations of Earth not even pretending to meet their targets. In a quiet moment, even believers in the Paris agreement agreed the obedient sods downunder were going to be hurt more by the Paris agreement than nearly anywhere else on Earth apart from OPEC and Russia. Heck, many years, we are the worlds largest coal exporter, and coal powers most of our electricity. To make it harder on ourselves the chief commodity we are disadvantaging happens to be our second largest export industry. On top of that, we’ve had the fastest population growth in the West, adding a staggering 50% more people since 1990. Is it not beyond obvious, that if a global CO2 agreement was needed, Australia is so unique it would occupy a dot all by itself in an orbit past the end of the graph?
Finally, the Australian Government is catching on — pointing out how well we’ve done, how we met our targets when most others have failed. And also — finally — trumpeting that our emissions cuts per capita are huge. Which they are. Far too large.
Since 1990 — Every Australian has cut CO2 emissions by 46%
Emissions per capita (grey line) are exceptional, but emissions per GDP dollar (orange line) are even better.
How to confuse a journalist
This week Scott Morrison flummoxed a room full of journalists and business types by mentioning that since 2005 we’ve already achieved a 36% cut in emissions. Adam Morton of The Guardian described this as “new” and said it was received with raised eyebrows across the room. It had no precedent in the global debate, he proclaimed, apparently astonished and quite confused:
“No explanation has been offered as to why this is a valid way to count emissions cuts – it has no precedent in the global debate. In the words of one analyst, it is a “Trumpian misrepresentation” of what the data actually says.”
That bad eh? But the real situation wouldn’t have surprised any of them if they’d been halfway competent, read what skeptics have said for years, or even done their own research. After all, the Greenhouse Office has been publishing these per capita graphs quarterly, forever. It’s not like it was a secret.
Is a per capita value “valid” asks Adam Morton?
What other method could possibly be better — asks Jo?
In a thirty year debate about doing our “fair share” what could be fairer than per person measures? Indeed, for years the Green Blob has been accusing Australia of being the “second worst in the world” per capita, and they still are. So if it’s OK to criticize us per capita — why was it not OK for the government to brag about our cuts — per capita?
The hard numbers: Australian emissions have been cut 46% per capita, while the population grew 50% larger and the GDP grew 135%.
- National inventory emissions per capita were 19.9 t CO2-e per person in the year to September 2020.
This represents a 46.2 per cent decline in national inventory emissions per capita from 37.0 t CO2-e
in the year to September 1990. Over the period from 1989-90 to September 2020, Australia’s population grew strongly from 17.0
million to around 25.7 million13,14. This reflects growth of 50.2 per cent. - Australia’s real GDP (chain volume measures) also experienced significant growth over this period,
expanding from $0.8 trillion in 1990 to around $1.9 trillion in the year to September 2020. This
represents a growth of 135.3 per cent.
— Quarterly update of Australia’s Greenhouse Gas Inventory, Sept 2020
Australia installs more renewables than anywhere else per capita
Morrison and co are not even using the Blakers et al graph below. In 2018 and 2019 Australians were installing renewable energy, faster than any place on Earth. Why don’t Australians know this?

Per capita, Australia (all shades of red) blitzed the field for installing renewables
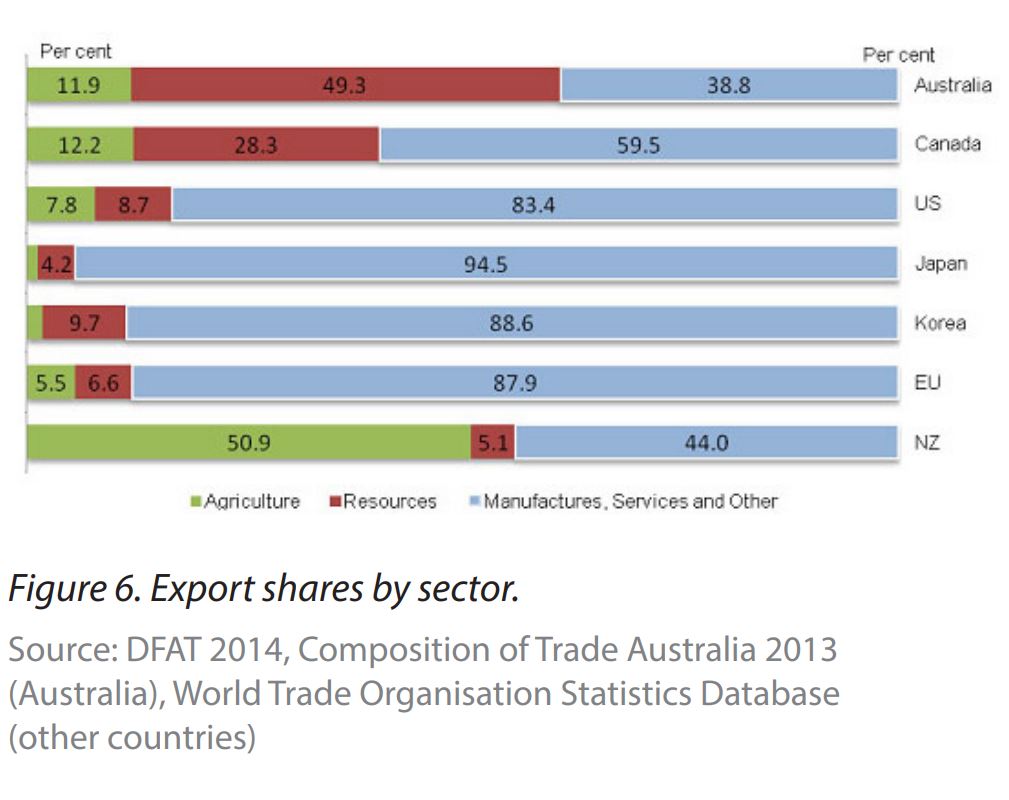
Australia is more dependent on mining and resources than most other developed nations:
Fully fifty percent of Australian exports are from mining. These are the most energy intensive exports on Earth, and the world needs these resources. Someone has to dig them up somewhere around the world, yet Australians’ get lumbered with all the emissions accrued in getting these minerals out of the ground?
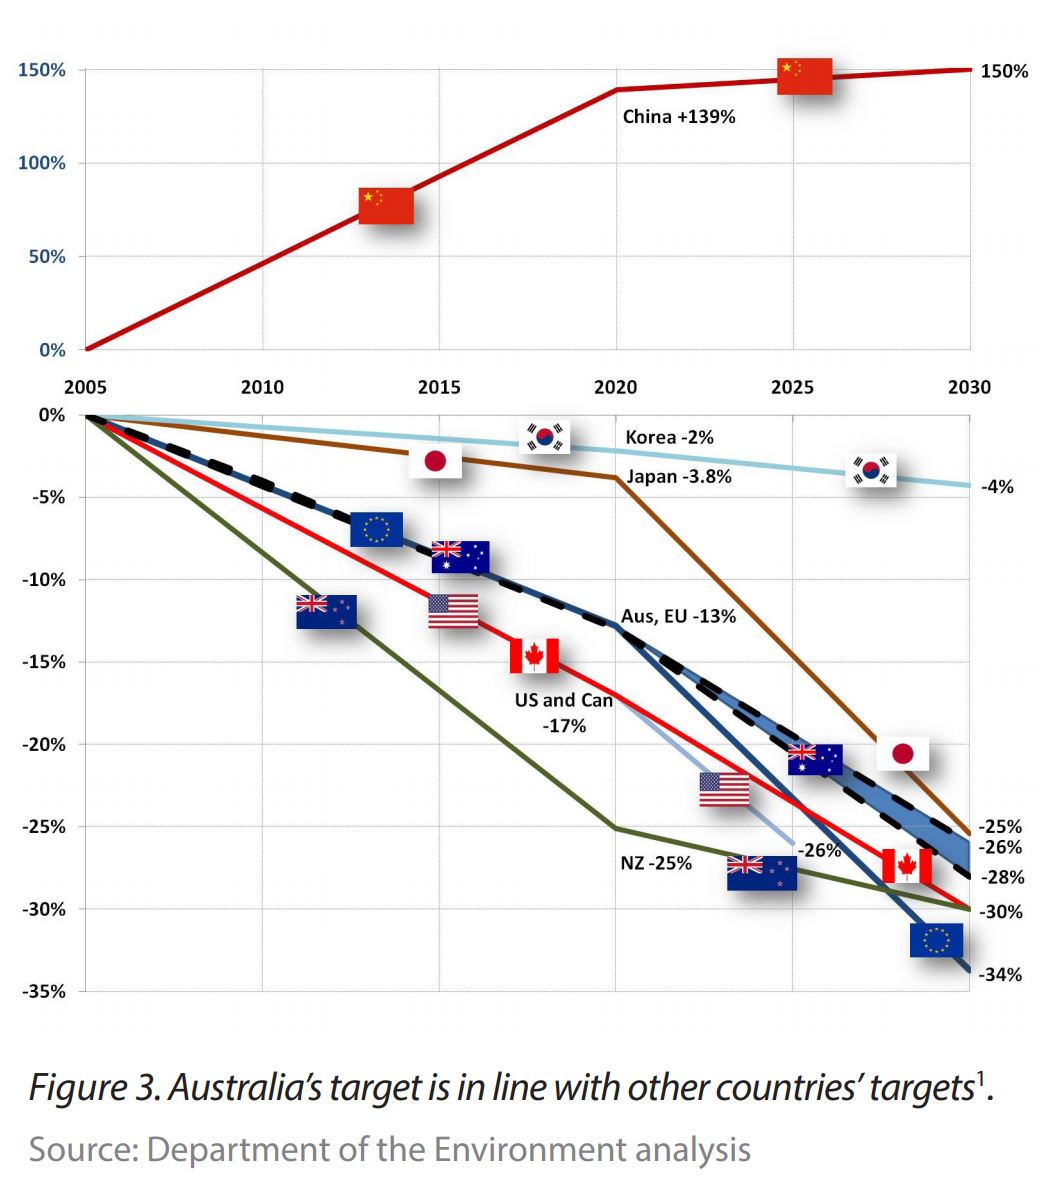
Australia is not falling behind even by the normal EU-biased way of accounting
The idea that Australia lags behind is a nonsense-stick to beat good people with.
The usual way of comparing emissions reductions is per country, not per capita. This suits the EU. Even so Australia has set a similar target compared to everywhere else, which only goes to show how bad our negotiators were. A long time ago, in the first Kyoto agreement John Howard’s team negotiated an 8% increase in emissions for Australia which made some allowance for our rapidly growing population, distances, and energy dependent export industries. Since then, Australian politicians have only managed to weekly, meekly, “join the pack” at our great disadvantage, and at the same time get harangued for not doing even more.
We don’t need to reduce CO2 at all, but if a government feels (because it is weak) that it has to pretend to go along with the global fashions, at least give Australians credit for “achieving” and negotiate properly. Put Australia first eh?
Our CO2 emissions are irrelevant in so many ways. We emit almost nothing compared to China. Global levels don’t seem to be controlled by our emissions anyway. It’s probably phytoplankton and ocean currents doing most of the emissions, not your car.
The world would be a better place, and Australians would be $18 billion dollars richer ten years from now, if we just spent a couple of million dollars doing goddamn due diligence checking the IPCC version of “science”.
Who audits the IPCC? No one.
UPDATE: Why we should remove “export” emissions from our tally:
Commenters are wondering what the point is of “export emissions” — this means the emissions we send into the sky in order to dig up the iron ore or the coal that other nations use. Because the Australian economy does so much of this heavy lifting for other nations, we are the Worlds Quarry, it’s not fair to count those emissions as our per capita emissions, instead of theirs. We are one of the worlds highest emitters per capita, because other nations have economies based on making t-shirts or software.
Chad asks whether our coal burnt overseas is counted in our emissions. (It isn’t)
But it’s a good question, and here’s my reply in comments below:
We count the emissions emitted to dig the stuff out, and for the transport (those bulk carriers fill up in our ports). So that includes emissions from 2km long trains hauling megatons of rock across hundreds of km. It includes all those 100T huge diesel trucks carrying rock out of deep holes. It includes flying a workforce 2,000 km from home to office etc. It includes building the gas rigs and towing them 2,000 km, plus manufacturing the machines/trucks/trains and also constructing buildings in remote locations and then airconditioning those buildings in 45C heat. Not to mention that fully 10% of the electricity in NSW and VIC is used in one smelter in each state. These are major consumers of fossil fuels. etc etc.
Once the coal arrives in China, theoretically, the burning of it, is “their CO2”.
REFERENCES
Australia’s 2030 Emission Reduction Target
Australia’s Low Technology Roadmap (a magic pick-the-winners wish list).
Scott Morrisons Address to the Business Council of Australia, 19th April, 2021.
Quarterly Update of Australia’s National Greenhouse Gas Inventory: Australia’s National Greenhouse Accounts, Department of Environment. Sept 2020. PDF