
Cambridge University Press
The Australian Bureau of Meteorology may not be meeting WMO, UK, US standards
Since the Australian BOM allows for one second “records”, it’s not clear it is even meeting guidelines recommended for amateurs.
The key question: How much of the warming trend in Australia is due to the switch in the mid 1990s from older slower thermometers to new electronic zippy ones that could record every waft of hot air? How many records today are just noise?
If the BOM would release its calibration and comparison data instead of deleting it, we might know. Why won’t they?
Here’s an example graph from Maryborough where the daily maximum was 1.5C above every thirty minute reading. Ouch — are we writing outliers and noise into our history books and climate data bases?
Add “sampling method” and averaging to your skeptical vocabulary. There will be a lot more discussion on these.
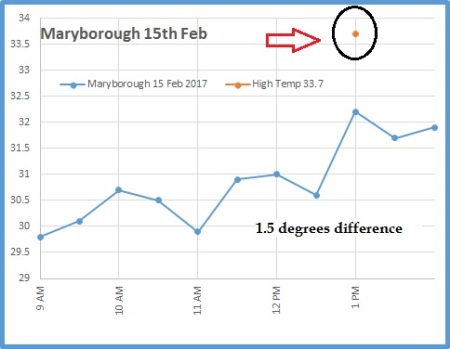
Maryborough. Graph by Ken Stewart.
Let’s consider some basic standards in the meteorology world
The Weather Observer’s Handbook 2012 tells us the new electronic sensors are more sensitive than the old mercury thermometers. The author, Stephen Burt, explains that the new electronic sensors can be too sensitive, and will record “minor random temperature fluctuations“. This means they will simply “generate slightly higher maximums and slightly lower minimums” than the older equipment did. Temperatures from new style thermometers must be averaged over longer periods to make them comparable with the older mercury thermometers, and also to “iron out minor stray electrical noise or sensor logger resolution artefacts.” h/t Chris Gillham.
The WMO, the UK Met office and the US all use longer average samples than Australia
The WMO recommend a one minute mean temperature standard be used, which is what the UK uses. In the US though, get this, meteorologists use a five minute average, and further below, Lin and Hubbard suggest it should be 7 minutes not five.

Further complexifying things — I hear the UK may put electronic sensors outside the Stevenson screens, which would make a big difference. Keep that in mind. UPDATED: Now I’m hearing, not so, it was just one photo.
Records, trends, daily ranges — they can all change with the sampling method
Was that really a record? Here’s a case where longer sampling times meant a record was not set on one day in Dodge city:

Weather Observers Handbook. Click to enlarge.
A good example is accorded by the maximum temperature recorded at Dodge City, Kansas during the heatwave which affected the southern and eastern states of America in summer 2011. Dodge City has one of the longest continuous temperature records in the United States, commencing in 1875. The hottest day on its long record stood at 110F (43.3C). On 26 June 2011 the highest 1 minute temperature observed was 111F (43.9C). However the value logged on an ASOS system was not accepted as a new record because ASOS take the maximum temperature as the highest 5 minute running mean, which was 110F. Thus the official high by the US method was 110F, tying rather than exceeding the previous record: by the WMO recommended method the maximum was 111F which would have set a new record.”
Here in Australia, with one second averaging, based on past behaviour, the new “record” could have been even higher, like 113F (45C) — who knows — which might have been measured for just one whole second. That kind of difference, which appears to be momentarily far above most of the data around it, has been entered into our official climate data online.
The Australian Bureau of Meteorology (BOM) responds with “Fast Facts”
In reply, the Bureau of Meteorology just published FAST FACTS: How does the Bureau measure temperature? Jennifer Marohasy has already responded on her blog that the Bureau are rewriting the rules (read it all).
Lets compare the Australian method to the US. In the US, researchers publish long papers on, say, the bias that occurs with two different ways of doing 5-minute averaging (more on that extraordinary detail below). The WMO only recommends a one minute average. Prepare yourself for the Australian BOM’s answer about why they don’t even do that (get ready to be surprised). Engineers everywhere may be crying…
The guide recommends that temperatures be integrated over time to smooth out rapid fluctuations. There is more than one method of achieving this. The WMO guidelines do not prescribe which method to take. In its automatic weather stations the Bureau achieves this by using platinum resistance thermometers. These are comparable to mercury in glass thermometers.
Say what? “Comparable” to mercury in glass? That last sentence goes against everything in the WMO guidelines and the handbook. It blithely writes off peer reviewed papers, not to mention engineering-common-sense. Apparently the BOM are claiming a bucket defacto-averaging kinda-in-the-system. Because their electronic sensors are inside the Stevenson screen, there is a sort of averaging — a lag, or a low pass filter — but probably one that changes minute-by-minute with the wind-speed. They also claim that the response-time of the sensor is as long or longer than the changes in the temperature of the air. (Color me unconvinced, where is that data?)
As Jen Marohasy points out, this is far from a declaration that the electronic sensors are averaging temperatures in the same way that the old slow liquid-in-glass ones do. (Did I mention the data….?)
The BOM:
This means that each one second temperature value is not an instantaneous measurement of the air temperature but an average of the previous 40 to 80 seconds. This process is comparable to the observation process of an observer using a “mercury-in-glass” thermometer.
Spot the weasel-word “comparable” (in both paragraphs). Comparable is not equivalent. One and ten are comparable, but they are not equivalent. (Just like one second and sixty seconds, Hmm?) When Ken Stewart looked in detail at the Australian data he found a lot of volatility — in the most extreme case, temperatures fell by almost 3 degrees C in under one minute. In 44 of 100 cases, temperatures changed by more than 0.3C in the following minute. That doesn’t smell like “smoothing” or averaging. Think about what kind of overarching volatility it would take to create a smoothed average that still had that kind of instability.
The bottom line: What we have is 20 years of incomplete raw data that includes random noise recorded from instruments that are nothing like the ones used for about eight of the last ten decades in Australian climate history. Somehow we are supposed to connect that data together?
The Bureau has a budget of $365 million a year, yet it’s looking like they have thrown away the raw detailed data for the last twenty years that might have been useful. What we are left with is — we have to ask — possibly not salvageable?
Where to from here?
The first thing the BOM needs to do is store all the b—– data. Second, it needs to make that public. Then we need to talk about changing the BOM sampling process and getting some averaging done properly. Then we need to set up a search and rescue team to go back through the last twenty years of electronic data and see what they can do. At this point, it would take a group of PhDs years to set up replica stations in many different conditions to gather enough data to be able to kinda “back predict” what the electronic data should have shown had it used a proper averaging method.
A one second wafting hot spike,
Gives a false average temperature hike,
Which for sensors is crude,
And with past records skewed,
Are the methods the B.O.M. like.
–Ruairi
________________
The Nitty Gritty: How temperatures are supposed to be measured
Now we get into some more detail about how different the standards are overseas. We get a better idea of things that muck up the data, so we can all start to appreciate how tricky this is — and perhaps what better management and processes might look like.
Even the US five minute averages are not necessarily good enough
A paper by Lin and Hubbard discusses in extraordinary detail how a systematic bias occur. They have complex graphs showing how different sensors respond to changes in air temperatures at different temperatures, and with different wind speeds. (TX, means maximum temp. TN means minimum.)
Liquid in glass thermometers are fundamentally different from electronic (platinum resistance) thermometers. They are not equivalent:
Although the LIG thermometers in the CRS also is an instantaneous observation for TX and TN the relatively large LIG thermometer’s time constant plays an exclusive role in filtering out high frequency temperatures and exponentially weighted smoothing temperature signals.
The bias (error) can be as large as 0.2°C (and they are talking about 5 min averages):
For the ASOS observations, the ASOS does have a 5- min running average for daily TX and TN, however, the even smaller sensor’s time constant in the ASOS makes its biases systematically significant (0.05–0.2 °C warmer on average TX or cooler on average TN).
Hence they recommend 7-minute averages:
.. “Commonly-used 5 min average was not sufficient for the fast-response thermometers in surface climate networks while the WMO standard thermometer (20 s time constant) should have a 7-min running average for reporting daily maximum and minimum temperatures. The surface temperature sensors with smaller time constant than the standard LIG thermometers must implement a follow-up running average algorithm.”
Calibration alone is not enough to remove this effect:
It should be noted that most of surface temperature calibrations, even highly accurate calibrations, are unable to remove out this type of out-of-phase uncertainties in the TX and TN because the instrument calibrations for climate networks usually are of static calibrations rather than a dynamic calibration process for the electronic surface temperature sensors and the LIG maximum and minimum thermometers…
Is that warm bias bigger than the cool bias?
From the same paper: In the field the maximum temperatures (fig 8) are affected more than the minima (figure 9). Note that they are comparing two different ways to average 5 minute readings, and they still find a difference. They are not looking at the change from one-second to five minutes. That is something entirely different.
Daytime air turbulence intensity usually is stronger than that during nighttime, thus, it is understandable that the TX differences shown in Figure 8 were larger than the TN differences in Figure 9.

Maximum temperature bias from different sampling rates. Lin, Hubbard. Figure 8.
…

Minimum temperature bias from different sampling rates. Lin, Hubbard. Figure 9.
Thermometers circa 1912
The whole point of averaging is so we can compare modern temperatures with ones recorded a hundred years ago. So check out Thermometric Lag (1912) which looks at the response time in different media including air at different wind speeds. The chart comes from a study published by the American Meteorological Society. Basically, if the wind is very still (slow in cm/sec) it takes a lot longer for a thermometer to respond to a change in temperature outside the screen. A thermometer in air may take over 3 minutes to respond on a still day. When wind speed is very fast, the change is more rapid.

..
THE BACKGROUND LIST — Scandal after scandal
- BOM Scandal: One second records in Australia — how “noise” creates history and a warming trend
- Another BOM scandal: Australian climate data is being destroyed as routine practice
- BOM scandal: “smart cards” filter out coldest temperatures. Full audit needed ASAP!
- BOM scandal heats up: Kininmonth, Watts, Nova quoted in The Australian “We audit banks, why not BOM?”
- Scandal: Australian Bureau of Meteorology caught erasing cold temperatures
- On Sunday, Goulburn got colder than the BOM thought was possible (and a raw data record was “adjusted”).
- Two-thirds of Australias warming due to “adjustments” — according to 84 historic stations
- The mysterious BOM disinterest in hot historic Australian Stevenson screen temperatures
- The lost climate knowledge of Deacon 1952: hot dry summers from 1880-1910
- 1953 Headline: Melbourne’s weather is changing! Summers getting colder and wetter
- The mysterious lost hot Sunday in Bourke, did it really happen?
- Wow, look at those BOM adjustments – trends up by two degrees C!
- Australian BOM “neutral” adjustments increase minima trends up 50%
- Was the Hottest Day Ever in Australia not in a desert, but in far south Albany?!
- Hottest summer record in Australia? Not so, says UAH satellite data
- Mystery black-box method used to make *all new* Australian “hottest” ever records
- BOMs new data set, ACORN, so bad it should be withdrawn (954 min temps larger than the max!)
- Threat of ANAO Audit means Australia’s BOM throws out temperature set, starts again, gets same results
- Australian Temperatures in cities adjusted up by 70%!?
 All kinds of other oddities of Australian temperature records were discussed in my chapter “Mysterious Revisions to Australia’s Long Hot History” in the new book Climate Change: The Facts 2017. Co-authors include Clive James, Matt Ridley, Willie Soon, Roy Spencer, and Anthony Watts. Get your copy now, the first edition sold out. Also available as Ebook on Amazon.
REFERENCES
Lin & Hubbard http://onlinelibrary.wiley.com/doi/10.1002/joc.1536/pdf Int. J. Climatol. 28: 283–294 (2008)