(See the Hammer link below, for more information on this graphic).
If there is one topic that trumps all others in climate science, it’s ocean heat.
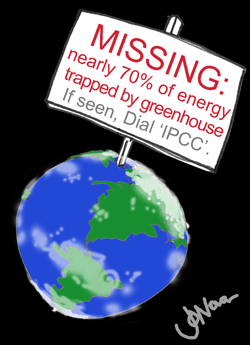
If there is a planetary imbalance in energy, and Earth is acquiring more heat than it’s losing, we ought to be able to find that heat. Energy can not be created nor destroyed. It has to be somewhere.
On this Water-Planet, virtually every scientist agrees that the vast bulk of the extra energy ought be stored in the water. The oceans cover 70% of the surface, and are 4km deep; water has a high heat capacity (meaning it can store a lot of energy), and, because water flows quickly (unlike rock), turbulence and mixing can take that heat energy away from the surface.
Every skeptic (and taxpayer) ought to know that since 2003 (when we started measuring oceans properly) the oceans have been cooling: Douglass and Knox 2010.
Five years of planetary heating amounts to a massive amount of energy. That’s 2,000 days of the sun bearing down on an atmosphere with growing levels of CO2. According to the IPCC favored models, the extra heat stored should be 0.7 x 10²² Joules per year (or 7,000,000,000,000,000,000,000 joules per annum or 7,000 quintillion joules).
The oceans cause a lot of “noise” in our climate — the water is 4km deep and mostly close to freezing, even in the depths under the tropics. When the ocean is “stirred” cold water wells up and sucks the heat out of the atmosphere giving us a La Nina and a cooler year. When the ocean is calm, the massive stores of “cold” stay sequestered below, the surface water warms faster, and satellite record an El Nino warm spike. Figuring out the effects of CO2 with surface thermometers is difficult because of this noise and variability. But the vast oceans are the giant storage depots for heat content year after year.

Positions of the floats that have delivered data within the last 30 days (AIC, updated daily)
The Argo buoy network uses 3,000 floating thermometers that spread through the worlds oceans and dive 2,000 m deep. They record the temperatures and radio them back when they surface every couple of weeks. It is the gold standard in measuring ocean temperatures. Argo became operational in mid-2003; before then we relied on erratic and highly uncertain measurements from boats. (See The UCSD Argo website.)

Figure 1. Ocean heat content from Argo (left scale: blue, original data; red, filtered) and ocean surface temperatures (right scale, green). Conversion of the OHC slope to W/m2 is made by multiplying by 0.62, yielding –0.161 W/m2. Figure 4 From Knox & Douglass page 1. OHC (Ocean Heat Content) From Douglass and Knox, 2010.
Critics (like Skeptical Science) will say it’s wrong to think this matters “you need to consider all the evidence”, including papers that show warming, measurements from the last 50 years through other techniques, and measurements from the deep ocean down to 2,000m. Superficially it sounds reasonable, except that none of that extra data adds better or more accurate information, or shows the Argo results are wrong and should be ignored. The ARGO system started in 2003. How could extra energy captured since 2003 have reached 2km underwater without heating the top 700m first? The oceans take about 1,000 years to fully churn. The time scales don’t make sense, and if the water 2,000m down is warming, it’s more likely that subterranean heat is rising up from the planet-sized-ball of molten lava below, rather than leap frogging down from atmospheric imbalances in a trace gas.
Lyman 2010 uses XBT data going back to 1990 and finds continuous warming. But XBT’s are much less reliable, and even he still finds things have flattened since 2003. This paper does not add to our Argo knowledge.
Purkey & Johnson 2010 look at depths down to 4,000m for the 1990s and 2000s (how is that relevant to CO2 induced warming in the last 10 years?) It’s not like recent coal emissions could have warmed the abyssal depths.
Who are the cherry pickers?
Skeptics will discuss any time frame, but fans of man-made global warming prefer to ignore trends in the last ten years or trends longer than 130 years. It all gets a bit complicated.
The oceans have warmed for the last 200 years, but that’s awkward, the timing doesn’t match with our CO2 emissions which rocketed from 1945 and can’t have caused the oceanic shift that started around 1800. The longer data doesn’t explain why we can’t find the warming for the last five years.
The ARGO data is simply so reliable, so comprehensive, and so detailed, and the number of absent joules so enormous, that we won’t find the missing heat that was supposedly stored in 2005 by looking at data from 1975. Averaging heat energy over longer periods with poorer quality or irrelevant data only muddies up what occurred from 2003 – 2009 (Rorschach test anyone?).
It’s just “noise”
Short periods of cooling could be due to natural forces overriding a warming effect, but what force is at work? The models didn’t predict the cooling, and can’t explain it. Therefore the models are missing a major factor (or ten). The “noise” excuse won’t wash with the oceans. If the energy is not in the oceans, where could it be? It’s not as though the heat can sneak underground, boil off a lake, or hide in a cloud for five years.
Where is that mass of missing heat from 2003 – 2008? It is either in the top layer of the oceans, or it’s been flung out to space. We won’t find it by looking back in time, or searching the bottom of the ocean. Anyone who pretends we will is playing a shell game. Watch the pea.
The bottom line:
The models say the Earth system ought to accrue energy at the rate of 3W/m2. Instead the best estimate we have of recent energy balance suggests we’ve been losing energy at a rate of about 0.1 W/m2 (Knox and Douglass 2010). The models don’t match the observations.
There is no getting around it. The models are wrong. The energy balance is so central that none of their other predictions can be relied on.

Ocean Heat Content compared to models
——————————————
Further Information:
Knox and Douglass — Abstract:
A recently published estimate of Earth’s global warming trend is 0.63 ± 0.28 W/m2, as calculated from ocean heat content anomaly data spanning 1993–2008. This value is not representative of the recent (2003–2008) warming/cooling rate because of a “flattening” that occurred around 2001–2002. Using only 2003–2008 data from Argo floats, we find by four different algorithms that the recent trend ranges from –0.010 to –0.160 W/m2 with a typical error bar of ±0.2 W/m2. These results fail to support the existence of a frequently-cited large positive computed radiative imbalance.
The odd case of the missing Argo data
Strangely with modern telecommunications, the latest ARGO buoy data is sometimes unavailable for months (see the bottom of this post). The Argo results travel at the speed of light back to base, yet for month after month skeptics asked for data while the publicly funded ARGO team did not upgrade the ARGO information. If the results had been a rapidly warming ocean, updates would have been issued every week (and with press releases). But when researcher Pielke asked for data it was flatly refused it in Sept 2010. Public outcry and blog pressure meant that eventually an update was released circa March 2011.
Useful links:
- The ARGO Data
- The deep oceans drive the atmosphere (Guest post by William Kininmonth)
- New claims that Ocean Heat Content are still rising are discussed in detail by Bob Tisdale. Despite the paucity of measurements below 1000m, the NCDC decided to add the deeper ARGO series to their 1950 -2010 graph on ocean heat. This creates a sudden uptick at the end of the graph. Scientifically, plastering a new data set onto a very thin weak one is dubious. We really can’t say much at all about the trend in ocean temperatures at that depth since 1950 because we just don’t have the data.
- See the complexity of mobile ocean temperatures in the beautiful animations on Bob Tisdale’s site.
- Douglass answers Trenberths criticisms.
- Michael Hammer did calculations on the Missing Heat and an update on those numbers too.
References
Knox, R.S. and Douglass D. H., (2010): Recent energy balance of Earth, International Journal of Geosciences, 2010, vol. 1, no. 3 [PDF]
Loehle, C., (2009): “Cooling of the global ocean since 2003,” Energy and Environment, Vol. 20, 101–104.
Douglass, D.H. and Knox, S.R. (2009): “Ocean heat content and Earth’s radiation imbalance,” Physics Letters A, Vol. 373, 3296–3300.
R. Pielke Sr (2008): “A broader view of the role of humans in the climate system,” Physics Today Vol. 61, no. 11, pp. 54-55
von Schuckmann, K., Gaillard, F., and Le Traon P.-Y. (2009): “Global hydrographic variability patterns during 2003-2008,” Journal of Geophysical Research C, Vol. 114, C09007.
——
UPDATE:* Douglass and Keen should have been Douglass and Knox. Fixed. Thanks Mark and Mattb 🙂