This is yet another example of things that don’t add up in the world of GISS temperatures in Australia. Previously, we’ve discussed Gladstone and Darwin.
Ken Stewart has been doing some homework, and you can see all the graphs on his blog. Essentially, the Bureau of Met in Australia provides data for Mt. Isa that shows a warming trend of about 0.5 degrees of warming over a century. GISS takes this, adjusts it carefully to “homogenize urban data with rural data”, and gets an answer of 1.1 degrees. (Ironically among other things, “homogenisation” is supposed to compensate for the Urban Heat Island Effect, which would artificially inflate the trend in urban centers.)
To give you an idea of scale, the nearest station is at Cloncurry, 106km east (where a flat trend of 0.05 or so appears in the graph). But, there are other trends that are warmer in other stations. Averaging the five nearest rural stations gives about 0.6 degrees; averaging the nearest ten stations gives between 0.6 and 0.88 degrees.

Mt Isa and surrounds with temperature trends
But, they increase the slope of the trendline from less than 0.5 to more than1.1 degrees Celsius per 102 years by lowering the earlier data by 0.3C. They say they do this because they homogenise urban data for discontinuities caused by station shifts, Urban Heat Island (UHI), etc., by their stated method: “…[U]rban stations are adjusted so that their long-term trend matches that of the mean of neighboring rural stations. Urban stations without nearby rural stations are dropped.” ( http://data.giss.nasa.gov/gistemp/)
The Mt Isa Graph
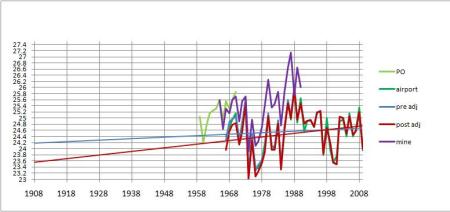
The Giss (red) line shows a steeper warming trend, because earlier data is adjusted down.
But in the end, the temperatures don’t fit linear trends very well. In Bourketown, for example, there was a rise, but it was mostly during 1945 – 1988, and in the last twenty years, as Ken points out, there has been a significant fall.
Burketown 327km north east

By themselves, these minor revisions wouldn’t be worth getting excited about, but the fact that they keep occurring and that they are so blatant and always in a warmer direction surely becomes too many nails in the coffin.
One can only assume that the people “adjusting” never thought anybody would check. And if billions of dollars were not on the table, probably nobody would have.
Thanks to Ken Stewart for his dedication.