Ice cores reveal that CO2 levels rise and fall hundreds of years after temperatures change
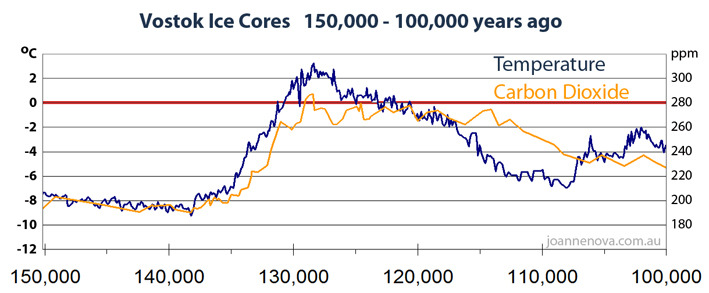
In 1985, ice cores extracted from Greenland revealed temperatures and CO2 levels going back 150,000 years. Temperature and CO2 seemed locked together. It was a turning point—the “greenhouse effect” captured attention. But, in 1999 it became clear that carbon dioxide rose and fell after temperatures did. By 2003, we had better data showing the lag was 800 ± 200 years. CO2 was in the back seat.
AGW replies: There is roughly an 800-year lag. But even if CO2 doesn’t start the warming trend, it amplifies it.
Skeptics say: If CO2 was a major driver, temperatures would rise indefinitely in a runaway greenhouse effect. This hasn’t happened in 500 million years, so either a mystery factor stops the runaway greenhouse effect, or CO2 is a minor force, and the models are missing the dominant driver.
Amplification is speculation. It’s a theory with no evidence that it matters in the real world.
Conclusion:
1. Ice cores don’t prove what caused past warming or cooling. The simplest explanation is that when temperatures rise, more carbon dioxide enters the atmosphere (because as oceans warm they release more CO2).
2. Something else is causing the warming.
Al Gore’s movie was made in 2005. His words about the ice cores were, “it’s complicated.” The lag calls everything about cause and effect into question. There is no way any honest investigation could ignore something so central.
Source: Carbon Dioxide Information Analysis Center http://cdiac.ornl.gov (See references at the bottom also).
A complete set of expanded full size graphs and print quality images is available from my Vostok Page.
Extra notes, references, and discussion about this page
The media blackout on “the lag” continues
The lag in the ice cores is old news to skeptics, but most people in the public still have no idea. This is page 5 of the HTML version of The Skeptics Handbook (the first booklet). I should have posted it long ago. The graph series and data are compelling. It’s one of the most basic features of climate science evidence, and yet it is so misused. Even tonight, I did a radio interview for NewstalkZB, New Zealand, and the pro-climate scare spokesman still referred to both the fraudulent Hockey Stick Graph and the Vostok Ice Cores as if they helped his case.
Between 1999 and 2003 a series of peer reviewed papers in the highest journals came out showing that carbon rises hundreds of years after temperature, and not before. What amazes me is that fully six years after Caillon et al in 2003 published their definitive paper, people still think the ice cores are evidence supporting the scare campaign. “The climate is the most important problem we face,” yet somehow not a single government department, popular science magazine or education department thought it was worth doing a close up of the graph and explaining to the public that there was a definitive, uncontested long lag, and that carbon always followed temperature.
The Al Gore style version (of which there are hundreds on-line, see below) hides the lag by compressing 420,000 years into one picture. If the public had known that temperatures lead carbon dioxide, Al Gore would not have been able to get away with using it they way he did.
In 2008, I marveled that with billions of dollars available to agencies and education campaigns, no one had graphed the lag as a close up. Why did it take an unfunded science communicator to get the data and graph it “as a hobby project”? I wanted to see that long lag; I wanted to be able to point at a graph and explain the lag to all the people who had no idea.
If you want to explore the thousands of years of those famous ice cores, the Vostok page has the full set of graphs, and this page right here is the place to comment and ask questions.
References
Petit et al 1999 — as the world cools into an ice age, the delay is several thousand years.
Fischer et al 1999 — described a lag of 600 ±400 years as the world warms.
Monnin et al 2001— Dome Concordia – found a delay on warming from the recent ice age 800 ± 600 years
Mudelsee 2001— over the full 420,000 year Vostok history, Co2 lags by 1,300 ± 1000 years.
Caillon et al 2003 — analysed the Vostok data and found a lag of 800 ± 200 years
UPDATED with full references
Petit, J.R., Jouzel, J., Raynaud, D., Barkov, N.I., Barnola, J.-M., Basile, I., Bender, M., Chappellaz, J., Davis, M., Delaygue, G., Delmotte, M., Kotlyakov, V.M., Legrand, M., Lipenkov, V.Y., Lorius, C., Pepin, L., Ritz, C., Saltzman, E., and Stievenard, M. 1999. Climate and atmospheric history of the past 420,000 years from the Vostok ice core, Antarctica. Nature 399: 429-436. [Discussion, CO2science]
Fischer, H., Wahlen, M., Smith, J., Mastroianni, D. and Deck B. 1999. Ice core records of atmospheric CO2 around the last three glacial terminations. Science 283: 1712-1714. [Discussion, CO2science]
Monnin, E., Indermühle, A., Dällenbach, A., Flückiger, J, Stauffer, B., Stocker, T.F., Raynaud, D. and Barnola, J.-M. 2001. Atmospheric CO2 concentrations over the last glacial termination. Science 291: 112-114. [Discussion, CO2science]
Mudelsee, M. 2001. The phase relations among atmospheric CO2 content, temperature and global ice volume over the past 420 ka. Quaternary Science Reviews 20: 583-589.
Caillon, N., Severinghaus, J.P., Jouzel, J., Barnola, J.-M., Kang, J. and Lipenkov, V.Y. 2003. Timing of atmospheric CO2 and Antarctic temperature changes across Termination III. Science 299: 1728-1731. [Discussion, CO2science]