Click for a larger (powerpoint size) image
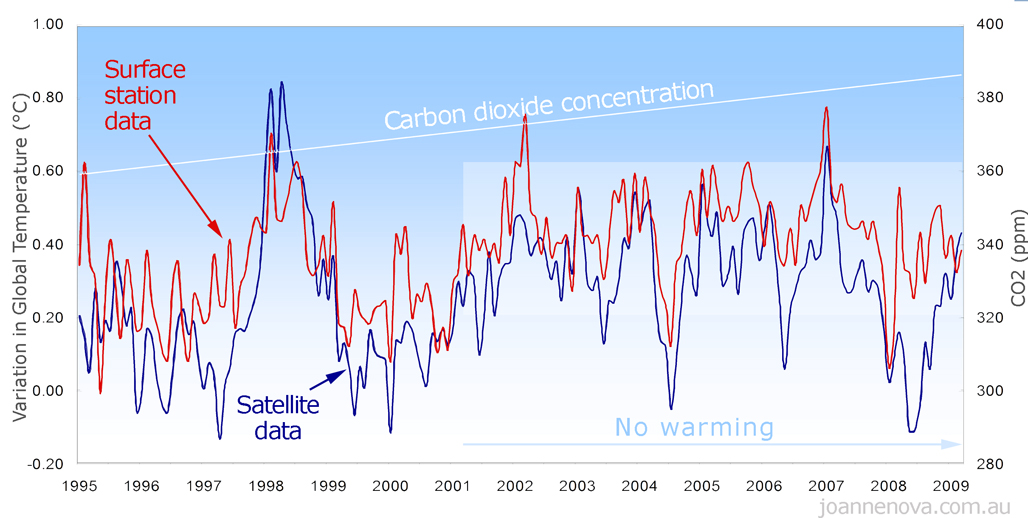
The world has not warmed since 2001.
Team-AGW reply #1: In the last decade we’ve had six (or seven or eight) of the top ten hottest years ever recorded.
Skeptics Say: True, but it doesn’t mean much. Clusters and longer trends are all that’s left when you can’t say ‘2009, or 2008, or 2007 was the hottest…’
The kicker is that the world has been warming since the Little Ice Age of the 1700’s, long before SUV’s. And records only started around 100 years ago. That’s not long. (See the Akasofu graph.)
Plus, many records were set by ground based stations, and a lot of these can’t be trusted. The Urban Heat Island effect means thermometers in cities are really measuring parking-lot-warming, or the-air-conditioner-effect, not global warming. Satellites have circled the planet 24 hours a day for 30 years recording temperatures continuously. If temperatures were still rising, they would see it.
AGW reply #2: This flat patch is just natural variation.
Skeptics say: “Natural variation” is caused by something. And it’s more important than carbon dioxide, because it is overpowering any CO2 warming. Even if the temperatures start going up again, the flat trend for seven years tells us the models are missing something big.
Models can’t accurately predict the climate over eight years, why should they be right over 80?
Conclusion: This doesn’t prove global warming is over, but it proves carbon dioxide is not the main driver. Something else is causing temperatures to change, something the computer models don’t include.
Extra Notes:
Note: I’m quite careful not to draw too strong a conclusion from this graph. I don’t say, “the world has cooled in the last 8 years, therefore AGW is wrong.” Nor do I say “there’s a cooling trend since 1998” – there is, but it’s not that relevant because 1998 was a big El Nino year. What I do say is that all the major climate models failed to predict this change in trend. And that matters, because climate models are the substitute for evidence for some people in this debate.
Here’s the line of reasoning Team-AGW used:
“The world has warmed since 1700 or 1800, and carbon dioxide levels have gone up. We’ve ruled out all the other factors, therefore all the extra warming is due to CO2.”
This is technically argument from ignorance—or in common terms: “It must be carbon because we can’t think of anything else.” It’s flawed reasoning from the start. Worse, Team-AGW want us to believe they can “rule out all the other forces”, and at the same time accept the idea that it’s OK that they got the last eight years wrong because of… er …”unexplained forces”.
They can’t have it both ways: either they can explain what drives the climate, and predict what happens next, or they can’t explain what drives the climate, and so they can’t calculate carbon dioxides effect.
We can’t rule out all the other forces if we don’t know what they are.
Notes for Commenters
This is page 6 of The Skeptics Handbook. I did this post because I wanted to update the graph and expand on these ideas; I’ve had requests for a html version, and I wanted to have a place for people to find out answers to specific questions about this particular page. So below, we can comment specifically on what this page means, (and what it doesn’t). People reading this may have come from outside sceptics circles, and they will be looking here to see what kind of criticisms and answers apply to this graph and this page. Please stick to thread 🙂
I will be posting up most other pages of the Handbook so we can discuss those on other posts.
| Sources: Satellite Data is from UAH, lower trophosphere 1979 – July 2009. Surface Data is from GISS, global monthly averages, 1979- June 2009. CO2 is from Mauna Loa. The data is graphed as a variation from the 12 month (1979) average period for both temperature sources. The CO2 line is the linear trend line chosen by Excel. Abbreviations |